Tentang proyek ini
Terutama pada tahun 2020, hujan deras dan deras secara instan telah menyebabkan efek merugikan pada rumah kaca dan hasil panen di negara saya. Sayangnya, akhir-akhir ini curah hujan yang tidak terduga dan berlebihan lebih sering terjadi dan menjadi relatif umum karena perubahan iklim di beberapa daerah. Sementara daerah lain mengalami kekeringan. Saat tahun 2020 berlalu, lebih dari tiga puluh lima insiden yang menyebabkan hilangnya panen dan ternak karena hujan deras dan deras tercatat di wilayah saya. Untuk berkontribusi pada solusi untuk mencegah dan mencegah masalah pemicu curah hujan yang berlebihan seperti hilangnya produktivitas pertanian, saya menganggap proyek ini sebagai titik awal.
Terutama, saya berfokus pada efek curah hujan yang berlebihan pada pertanian dalam proyek ini. Namun, curah hujan yang berlebihan dapat menyebabkan banyak bahaya, misalnya [1]:
- banjir, termasuk risiko terhadap nyawa manusia,
- kerusakan bangunan dan infrastruktur,
- kehilangan panen dan ternak,
- tanah longsor, yang dapat mengancam kehidupan manusia, mengganggu transportasi dan komunikasi.
Seperti yang ditunjukkan dalam studi terbaru, curah hujan yang berlebihan dapat mempengaruhi produktivitas tanaman dalam berbagai cara, termasuk kerusakan fisik langsung, penanaman dan panen yang tertunda, pertumbuhan akar yang terbatas, kekurangan oksigen, dan kehilangan nutrisi. Jadi, terlalu banyak hujan bisa sama berbahayanya dengan kekeringan untuk pertanian:"Data dari tiga dekade terakhir menunjukkan bahwa curah hujan yang berlebihan dapat mempengaruhi hasil panen seperti halnya panas dan kekeringan yang berlebihan. Dalam sebuah studi baru, tim interdisipliner dari University of Illinois menghubungkan data asuransi tanaman, iklim, tanah, dan hasil jagung dari tahun 1981 hingga 2016. Studi ini menemukan bahwa, selama beberapa tahun, curah hujan yang berlebihan mengurangi hasil jagung AS sebanyak 34% dibandingkan dengan hasil yang diharapkan. kekeringan dan panas yang berlebihan menyebabkan kehilangan hasil hingga 37% selama beberapa tahun [2]" .
Sayangnya, sistem peringatan dini tidak cukup untuk sepenuhnya mencegah memperburuk efek curah hujan yang berlebihan pada produk dan proses pertanian tanpa data cuaca lokal yang memadai dan awal untuk setiap rumah kaca atau pertanian. Oleh karena itu, dengan harapan untuk menghindari efek merugikan dari curah hujan yang berlebihan pada pertanian, saya memutuskan untuk membuat proyek ini sebagai stasiun cuaca jarak jauh yang hemat anggaran untuk mengumpulkan dan menafsirkan informasi cuaca lokal guna membuat prediksi yang lebih akurat tentang intensitas curah hujan.
Setelah melakukan penelitian tentang deep learning dan neural network, saya memutuskan untuk membangun artificial neural network (ANN) berdasarkan model klasifikasi untuk menginterpretasikan akumulasi data cuaca lokal untuk memprediksi intensitas curah hujan sesuai dengan kelas yang diberikan. Seperti yang ditunjukkan oleh studi berikut, para peneliti telah menerapkan model dan tipe jaringan saraf yang berbeda untuk meramalkan tidak hanya curah hujan tetapi juga fenomena cuaca:"Banyak eksperimen telah menggunakan jaringan saraf untuk memprediksi jumlah curah hujan kuantitatif di berbagai lokasi dan rentang pandang. Misalnya, para peneliti di Thailand dapat memperoleh prakiraan yang sangat akurat menggunakan jaringan saraf feed-forward untuk memprediksi jumlah curah hujan kuantitatif dalam rentang satu hingga tiga jam untuk memprediksi kemungkinan bahaya banjir.Jaringan saraf juga telah digunakan untuk memprediksi fenomena cuaca selain nilai prakiraan tradisional, seperti probabilitas/jumlah curah hujan, kecepatan angin, tekanan udara, dll. Mereka telah sangat berhasil digunakan untuk memprediksi tornado. Selain itu, peneliti di Australia berhasil menggunakan jaringan saraf untuk mengidentifikasi kabut di berbagai prakiraan berkisar antara 3 jam hingga 18 jam di sekitar Bandara Internasional Canberra [3]."
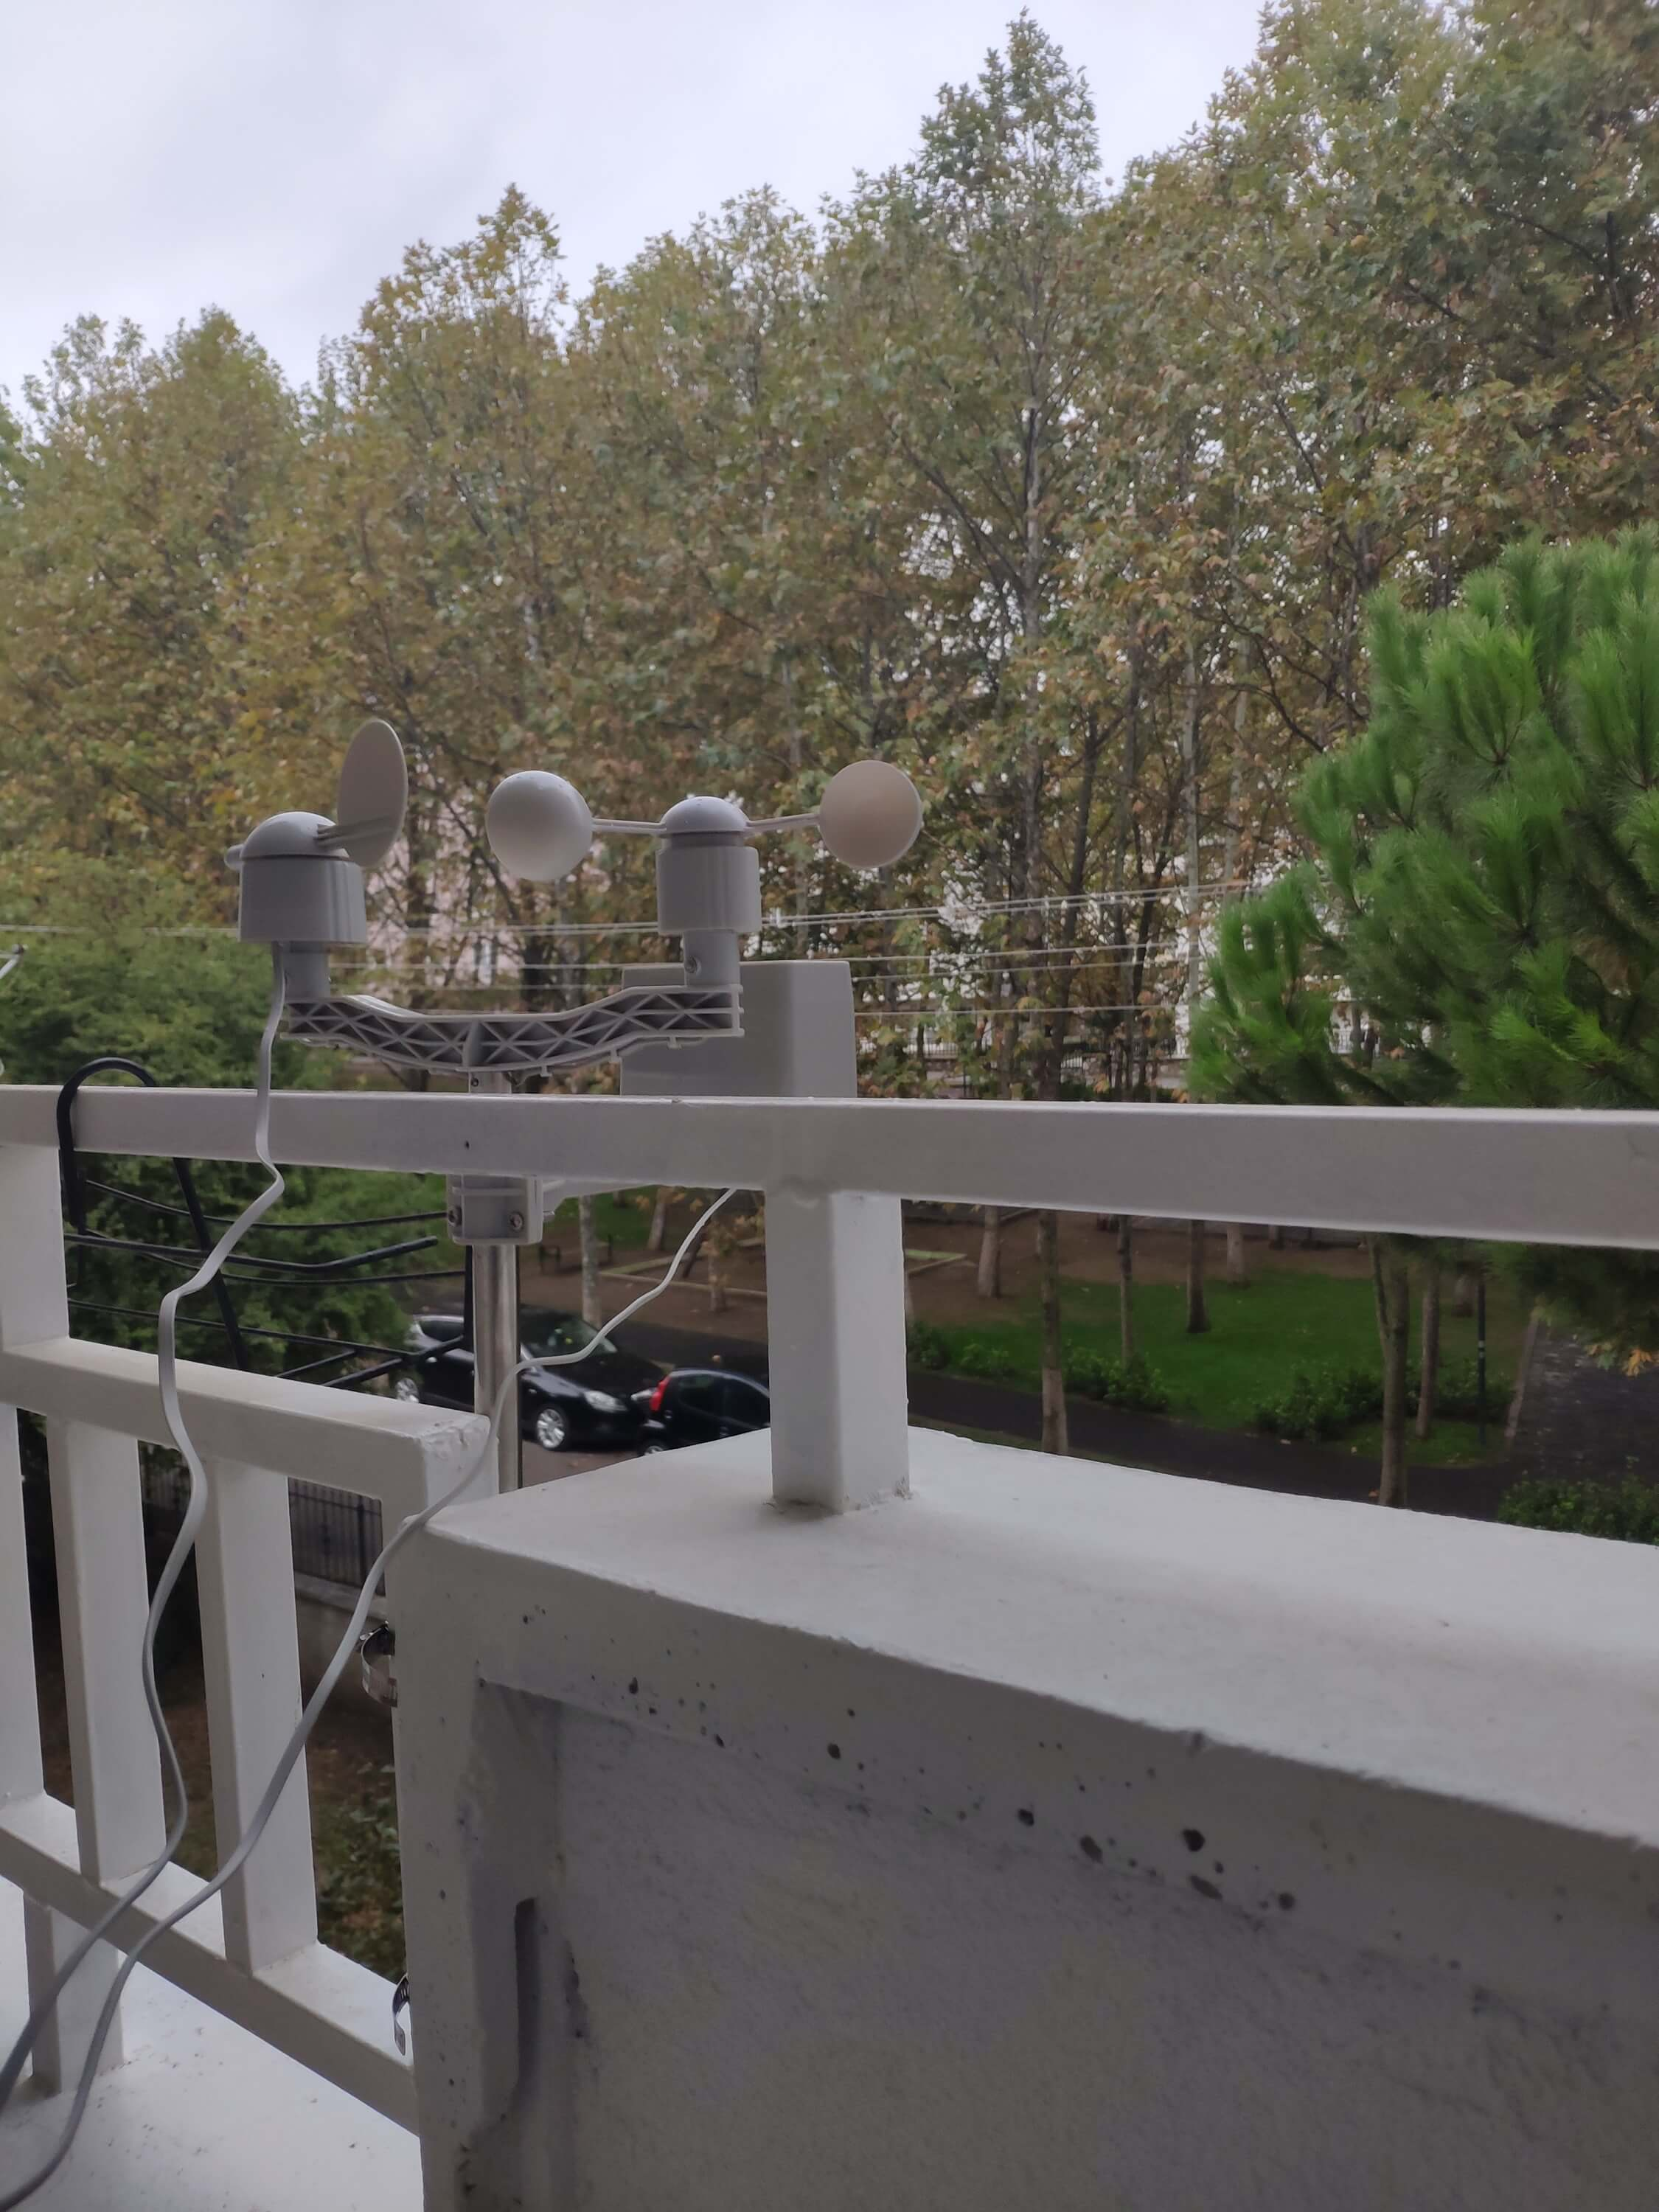
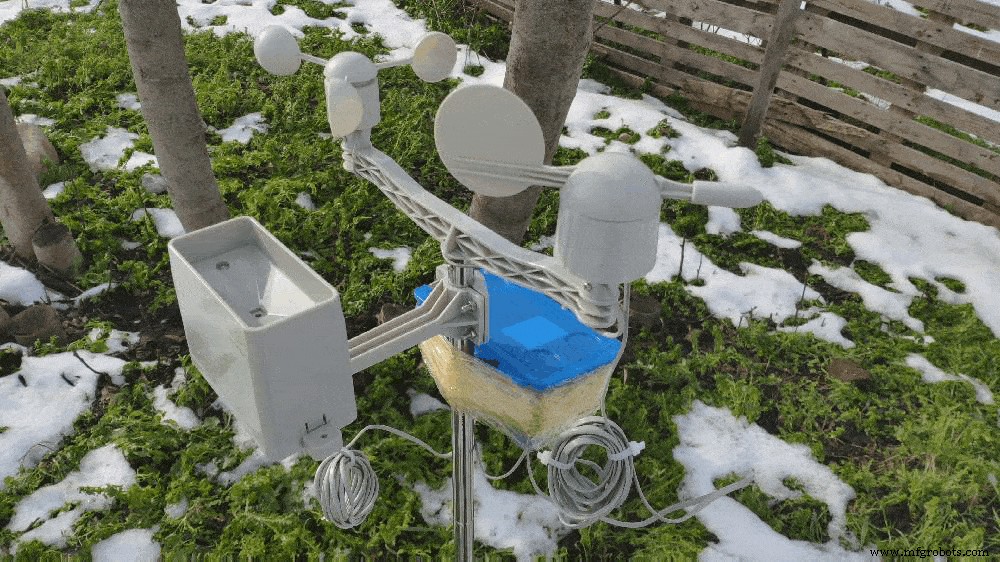
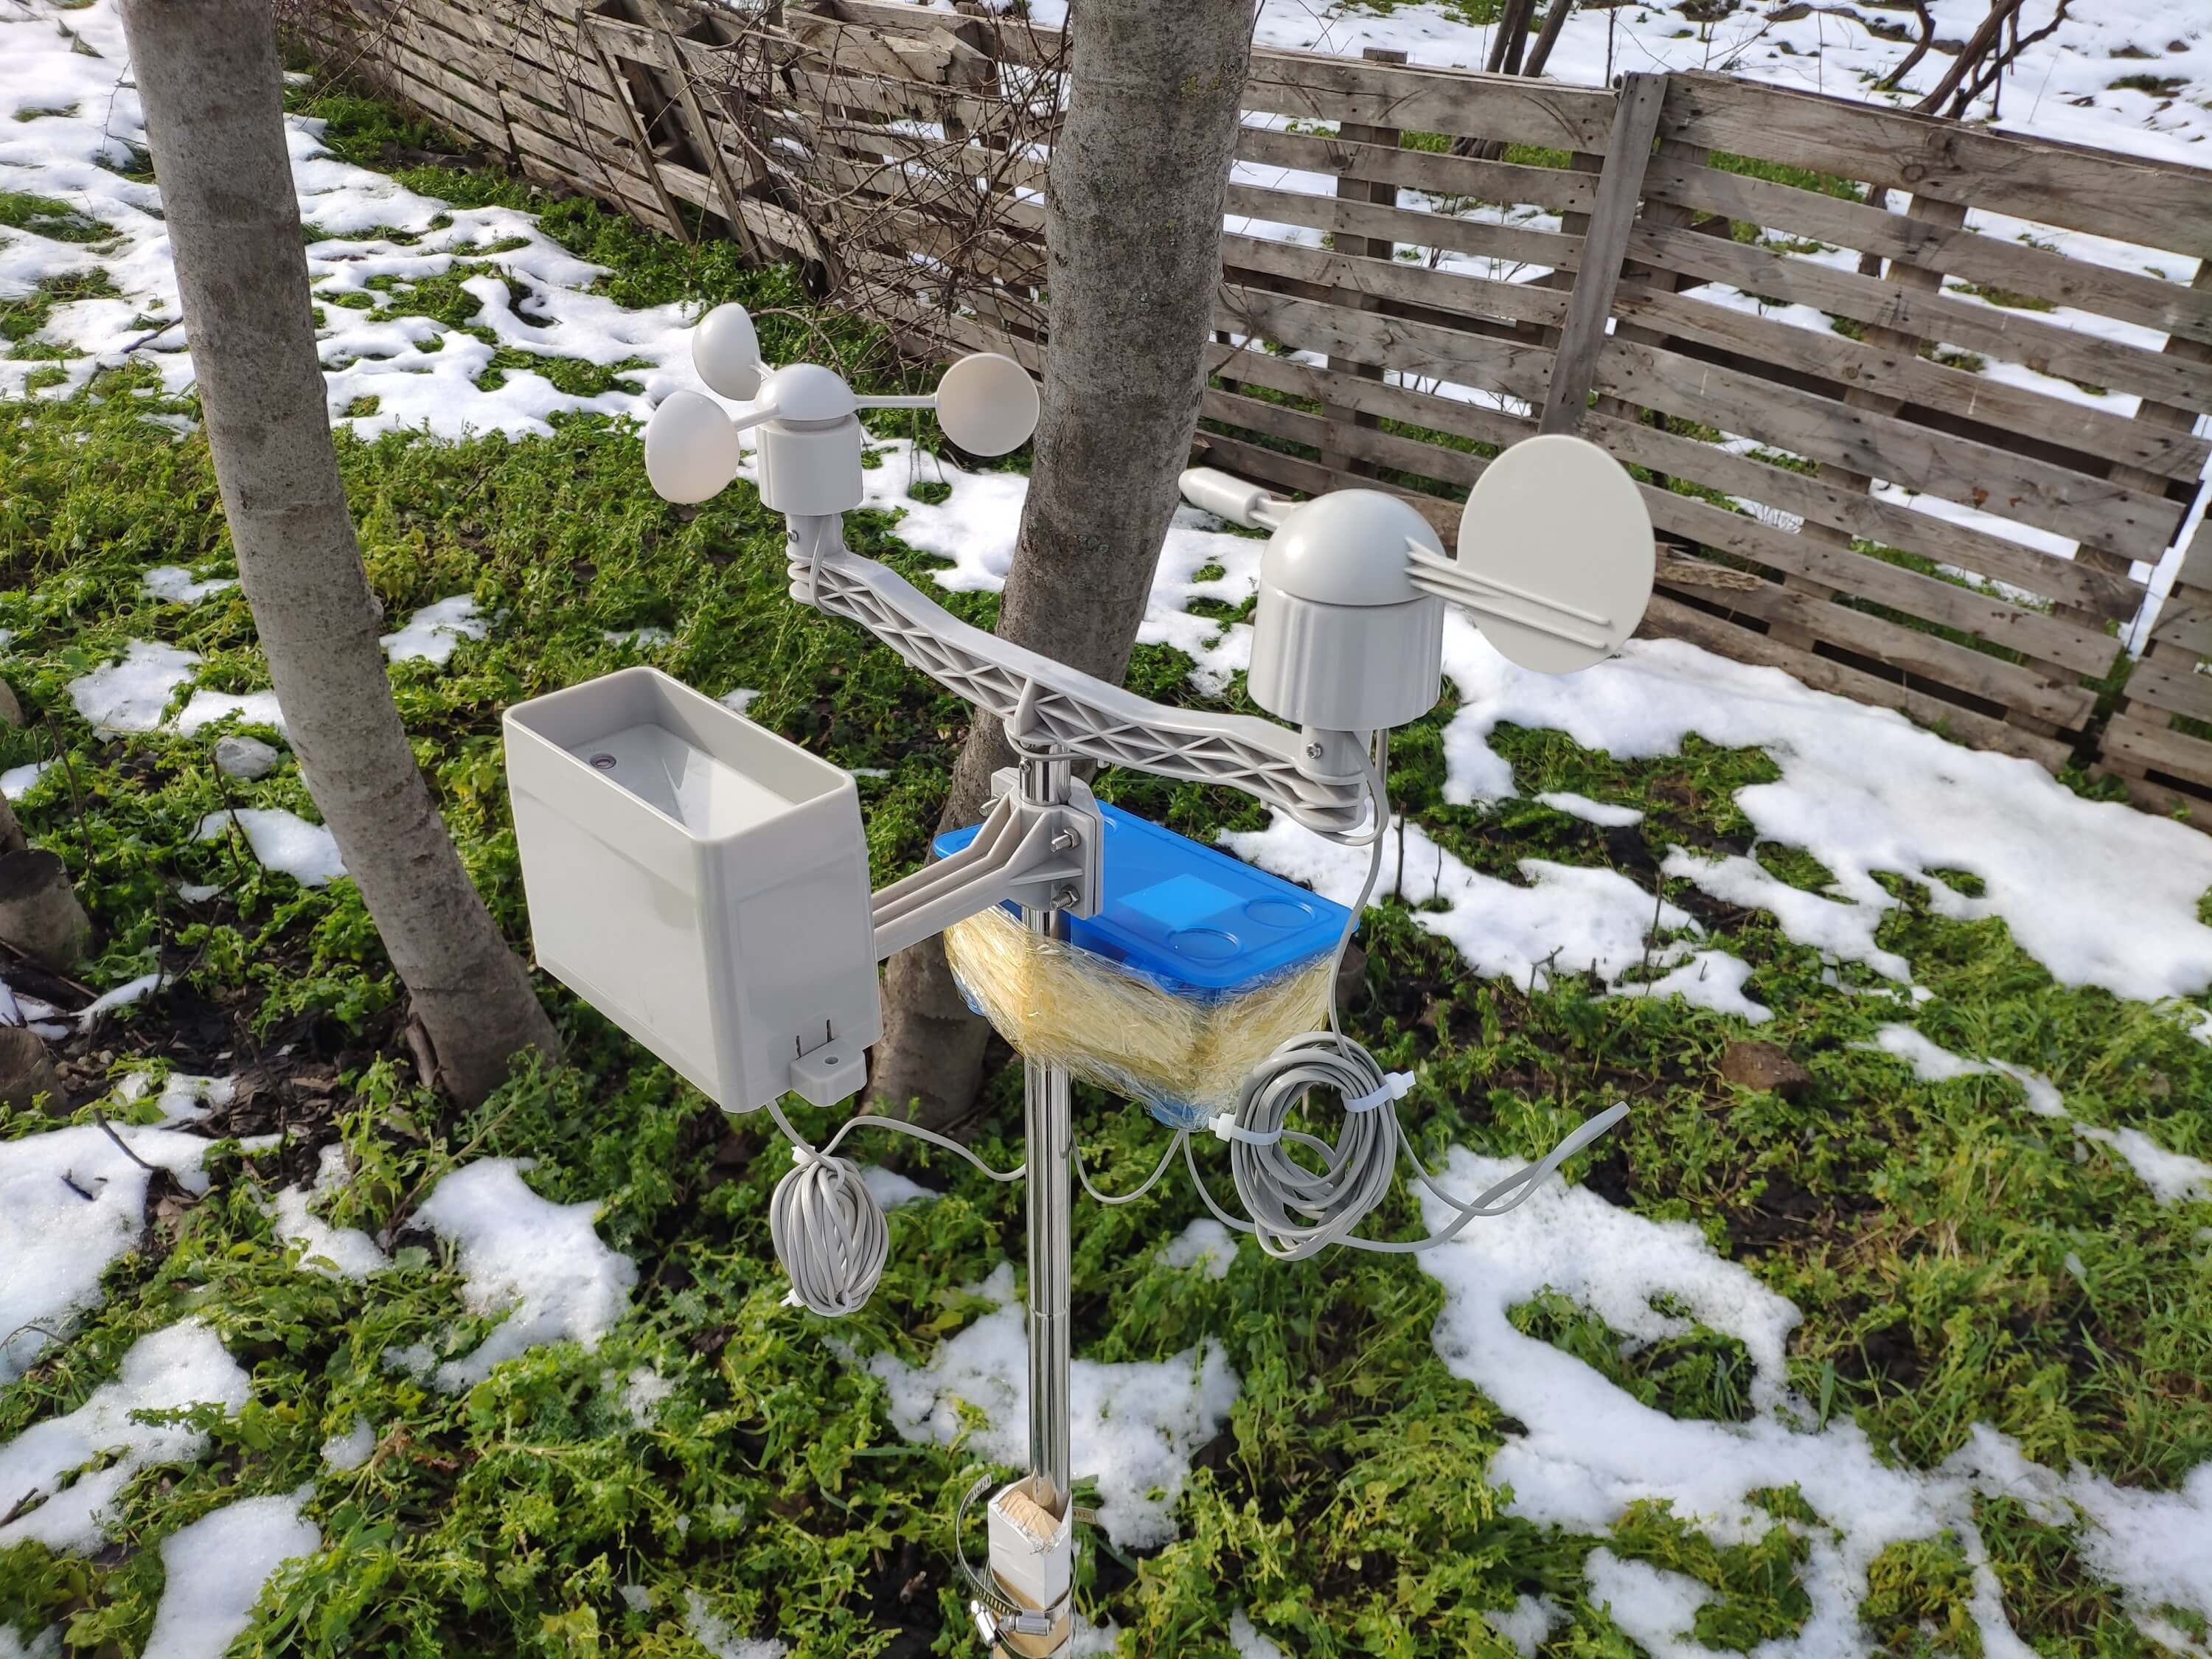
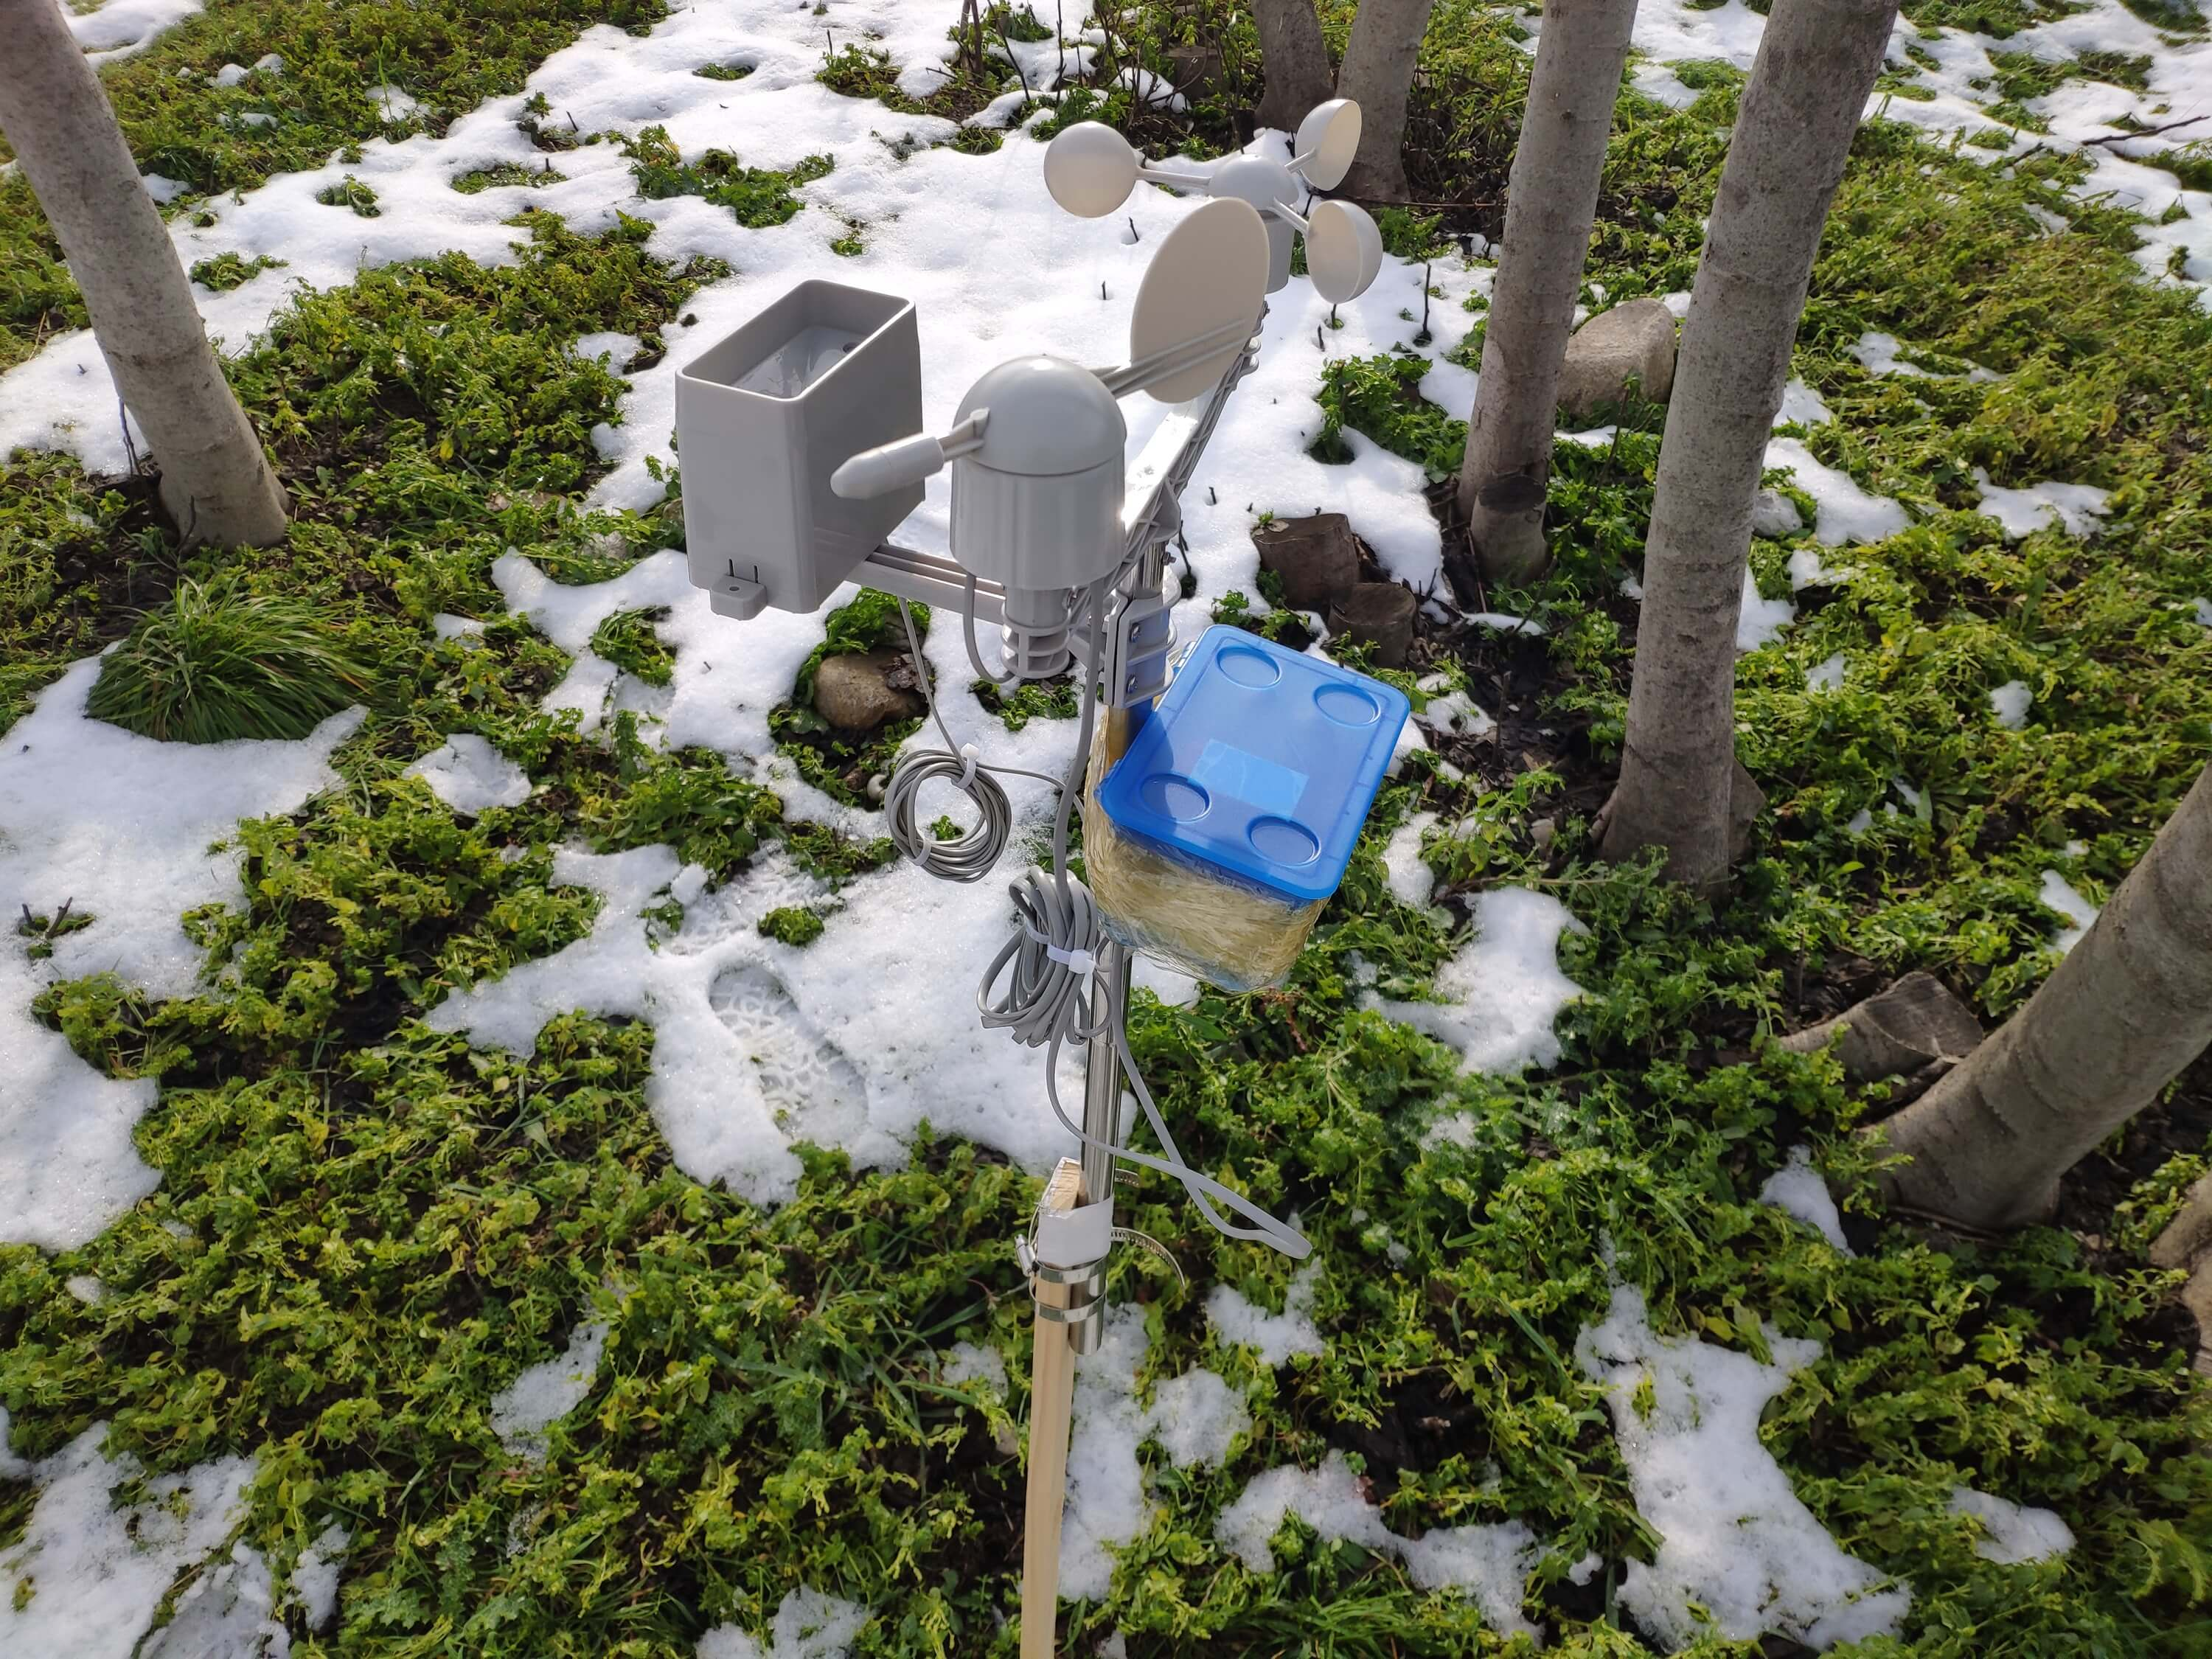
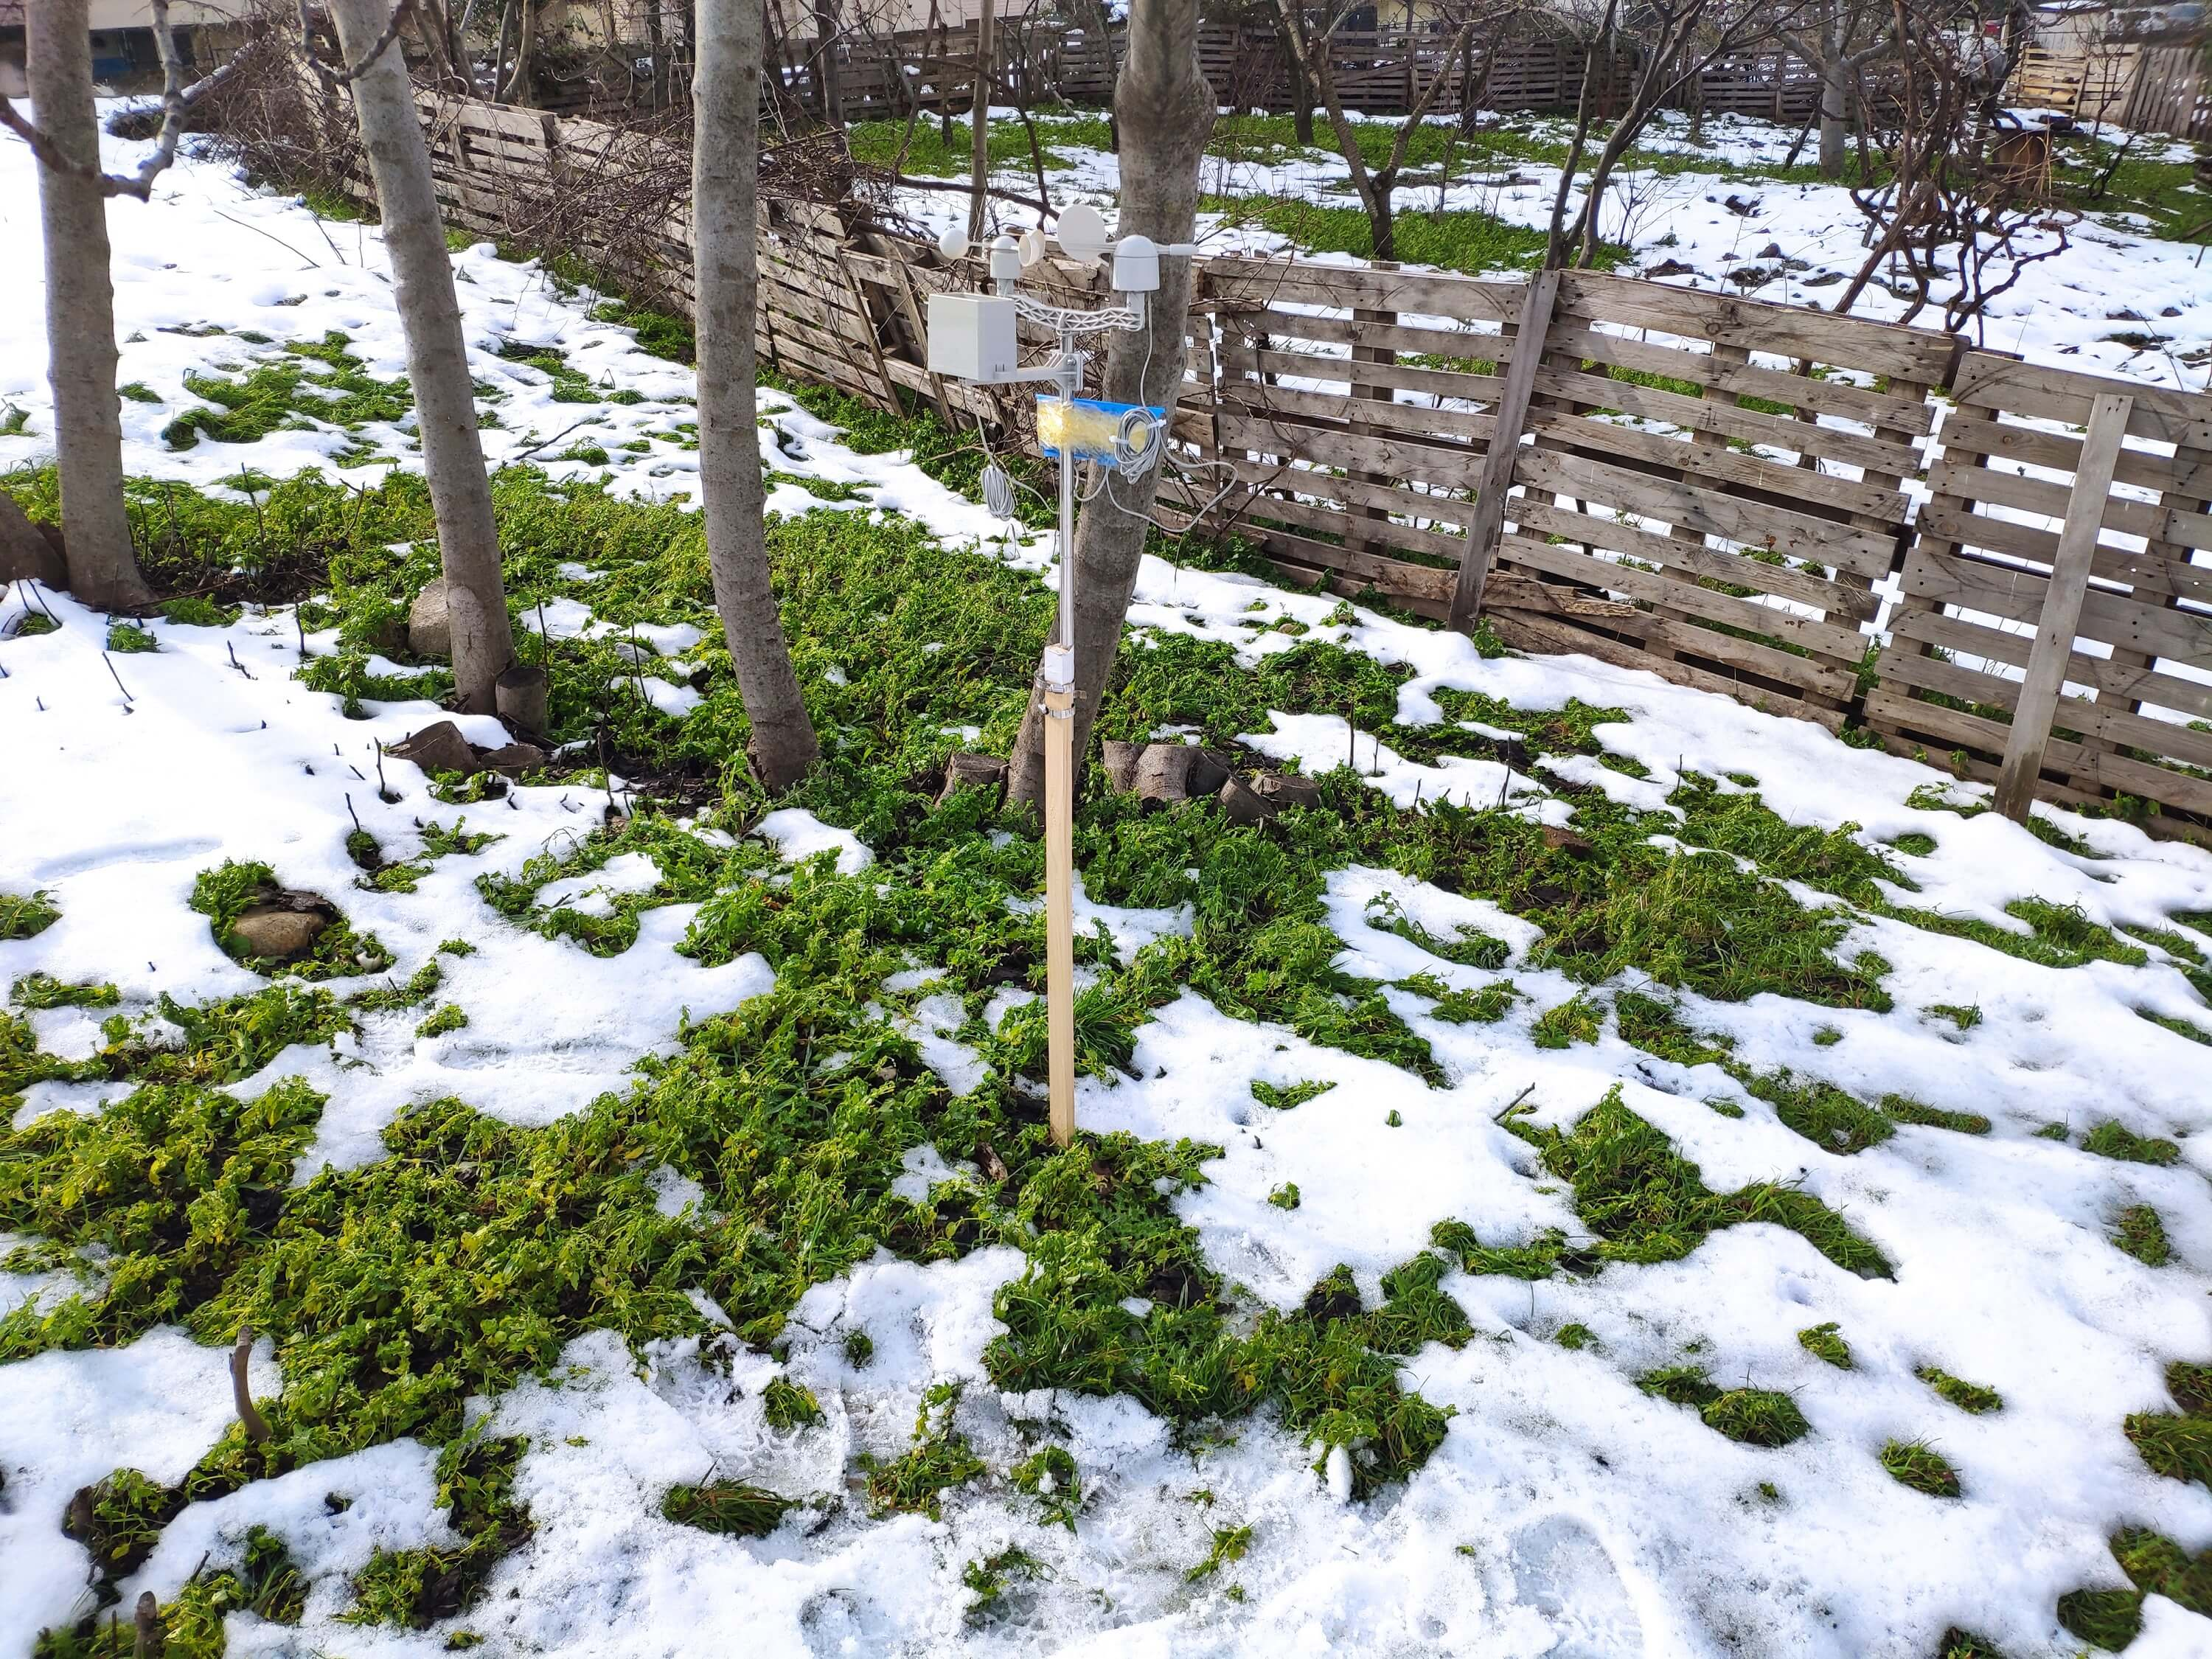
Sebelum membangun dan menguji model jaringan saraf saya, saya telah mengumpulkan data cuaca di balkon dan halaman belakang saya dalam radius tiga kilometer selama lebih dari tiga bulan untuk membuat kumpulan data cuaca lokal yang menunjukkan informasi cuaca di lingkungan saya. Untuk dapat memperoleh informasi cuaca bahkan dalam kondisi cuaca ekstrem, saya menggunakan Weather Station Kit dengan Anemometer, Wind Vane, dan Rain Bucket oleh DFRobot dengan dua papan pengembangan yang berbeda:
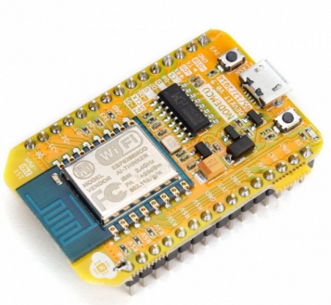
- NodeMCU ESP-12E (WiFi-Enabled)
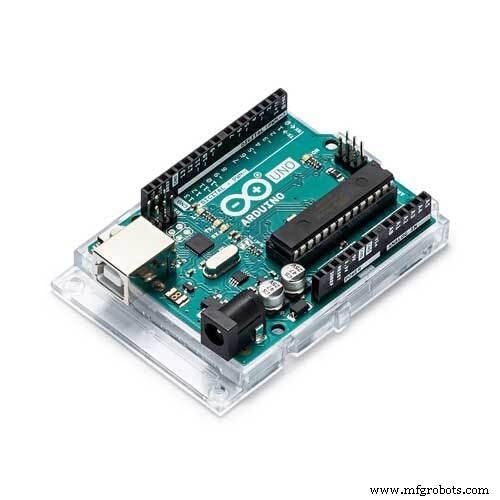
- Arduino Uno + DFRobot SIM808 GPS/GPRS/GSM Shield (GPRS-Enabled)
Dengan demikian, saya dapat mentransfer data cuaca melalui WiFi di balkon atau GPRS saya jika jarak antara router saya dan stasiun cuaca terlalu jauh.
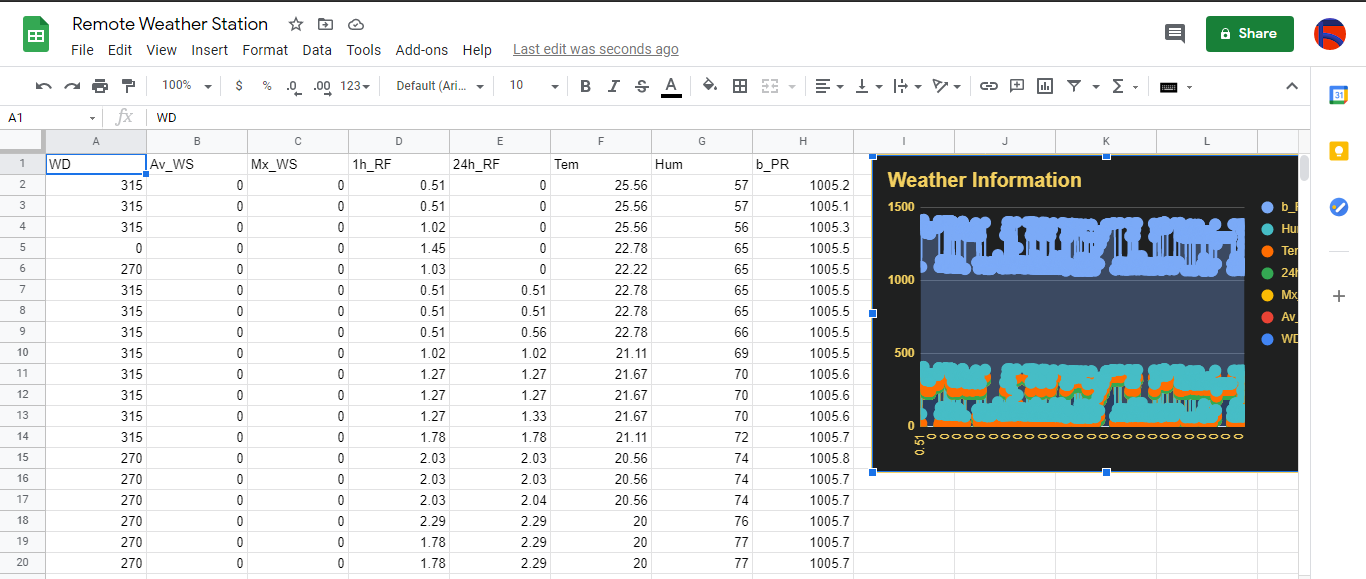
Saya memutuskan untuk menggunakan Google Sheets, program spreadsheet berbasis cloud, untuk menyusun data cuaca yang dihasilkan oleh stasiun cuaca karena membuat kumpulan data besar dan menambahkan informasi baru mudah dilakukan dengan Google Sheets API. Oleh karena itu, saya mengembangkan aplikasi web di PHP untuk mendapatkan data cuaca yang ditransfer oleh papan pengembangan dan menambahkannya ke spreadsheet di Google Spreadsheet.
Setelah menyelesaikan pengumpulan data cuaca selama lebih dari tiga bulan setiap lima menit, saya membangun model jaringan saraf tiruan (JST) dengan TensorFlow untuk membuat prediksi intensitas curah hujan. Secara teoritis, saya menetapkan kelas intensitas curah hujan untuk setiap pembacaan setelah penskalaan dan normalisasi kumpulan data. Kemudian, saya melatih model jaringan saraf untuk mengklasifikasikan kelas-kelas ini:
- Tidak Ada Curah Hujan
- Curah Hujan Ringan
- Curah Hujan Sedang
- Hujan deras
- Hujan deras
Jadi, ini adalah proyek saya secara singkat
Dalam langkah-langkah berikut, Anda dapat menemukan informasi yang lebih mendetail tentang pengkodean, pengumpulan data cuaca lokal, dan membangun model jaringan saraf tiruan (JST) dengan TensorFlow.
Terima kasih banyak kepada DFRobot karena telah mensponsori proyek ini.
Produk yang disponsori oleh DFRobot:
Kit Stasiun Cuaca dengan Anemometer/Vangin Angin/Ember Hujan | Periksa
SIM808 GPS/GPRS/GSM Perisai Untuk Arduino | Periksa
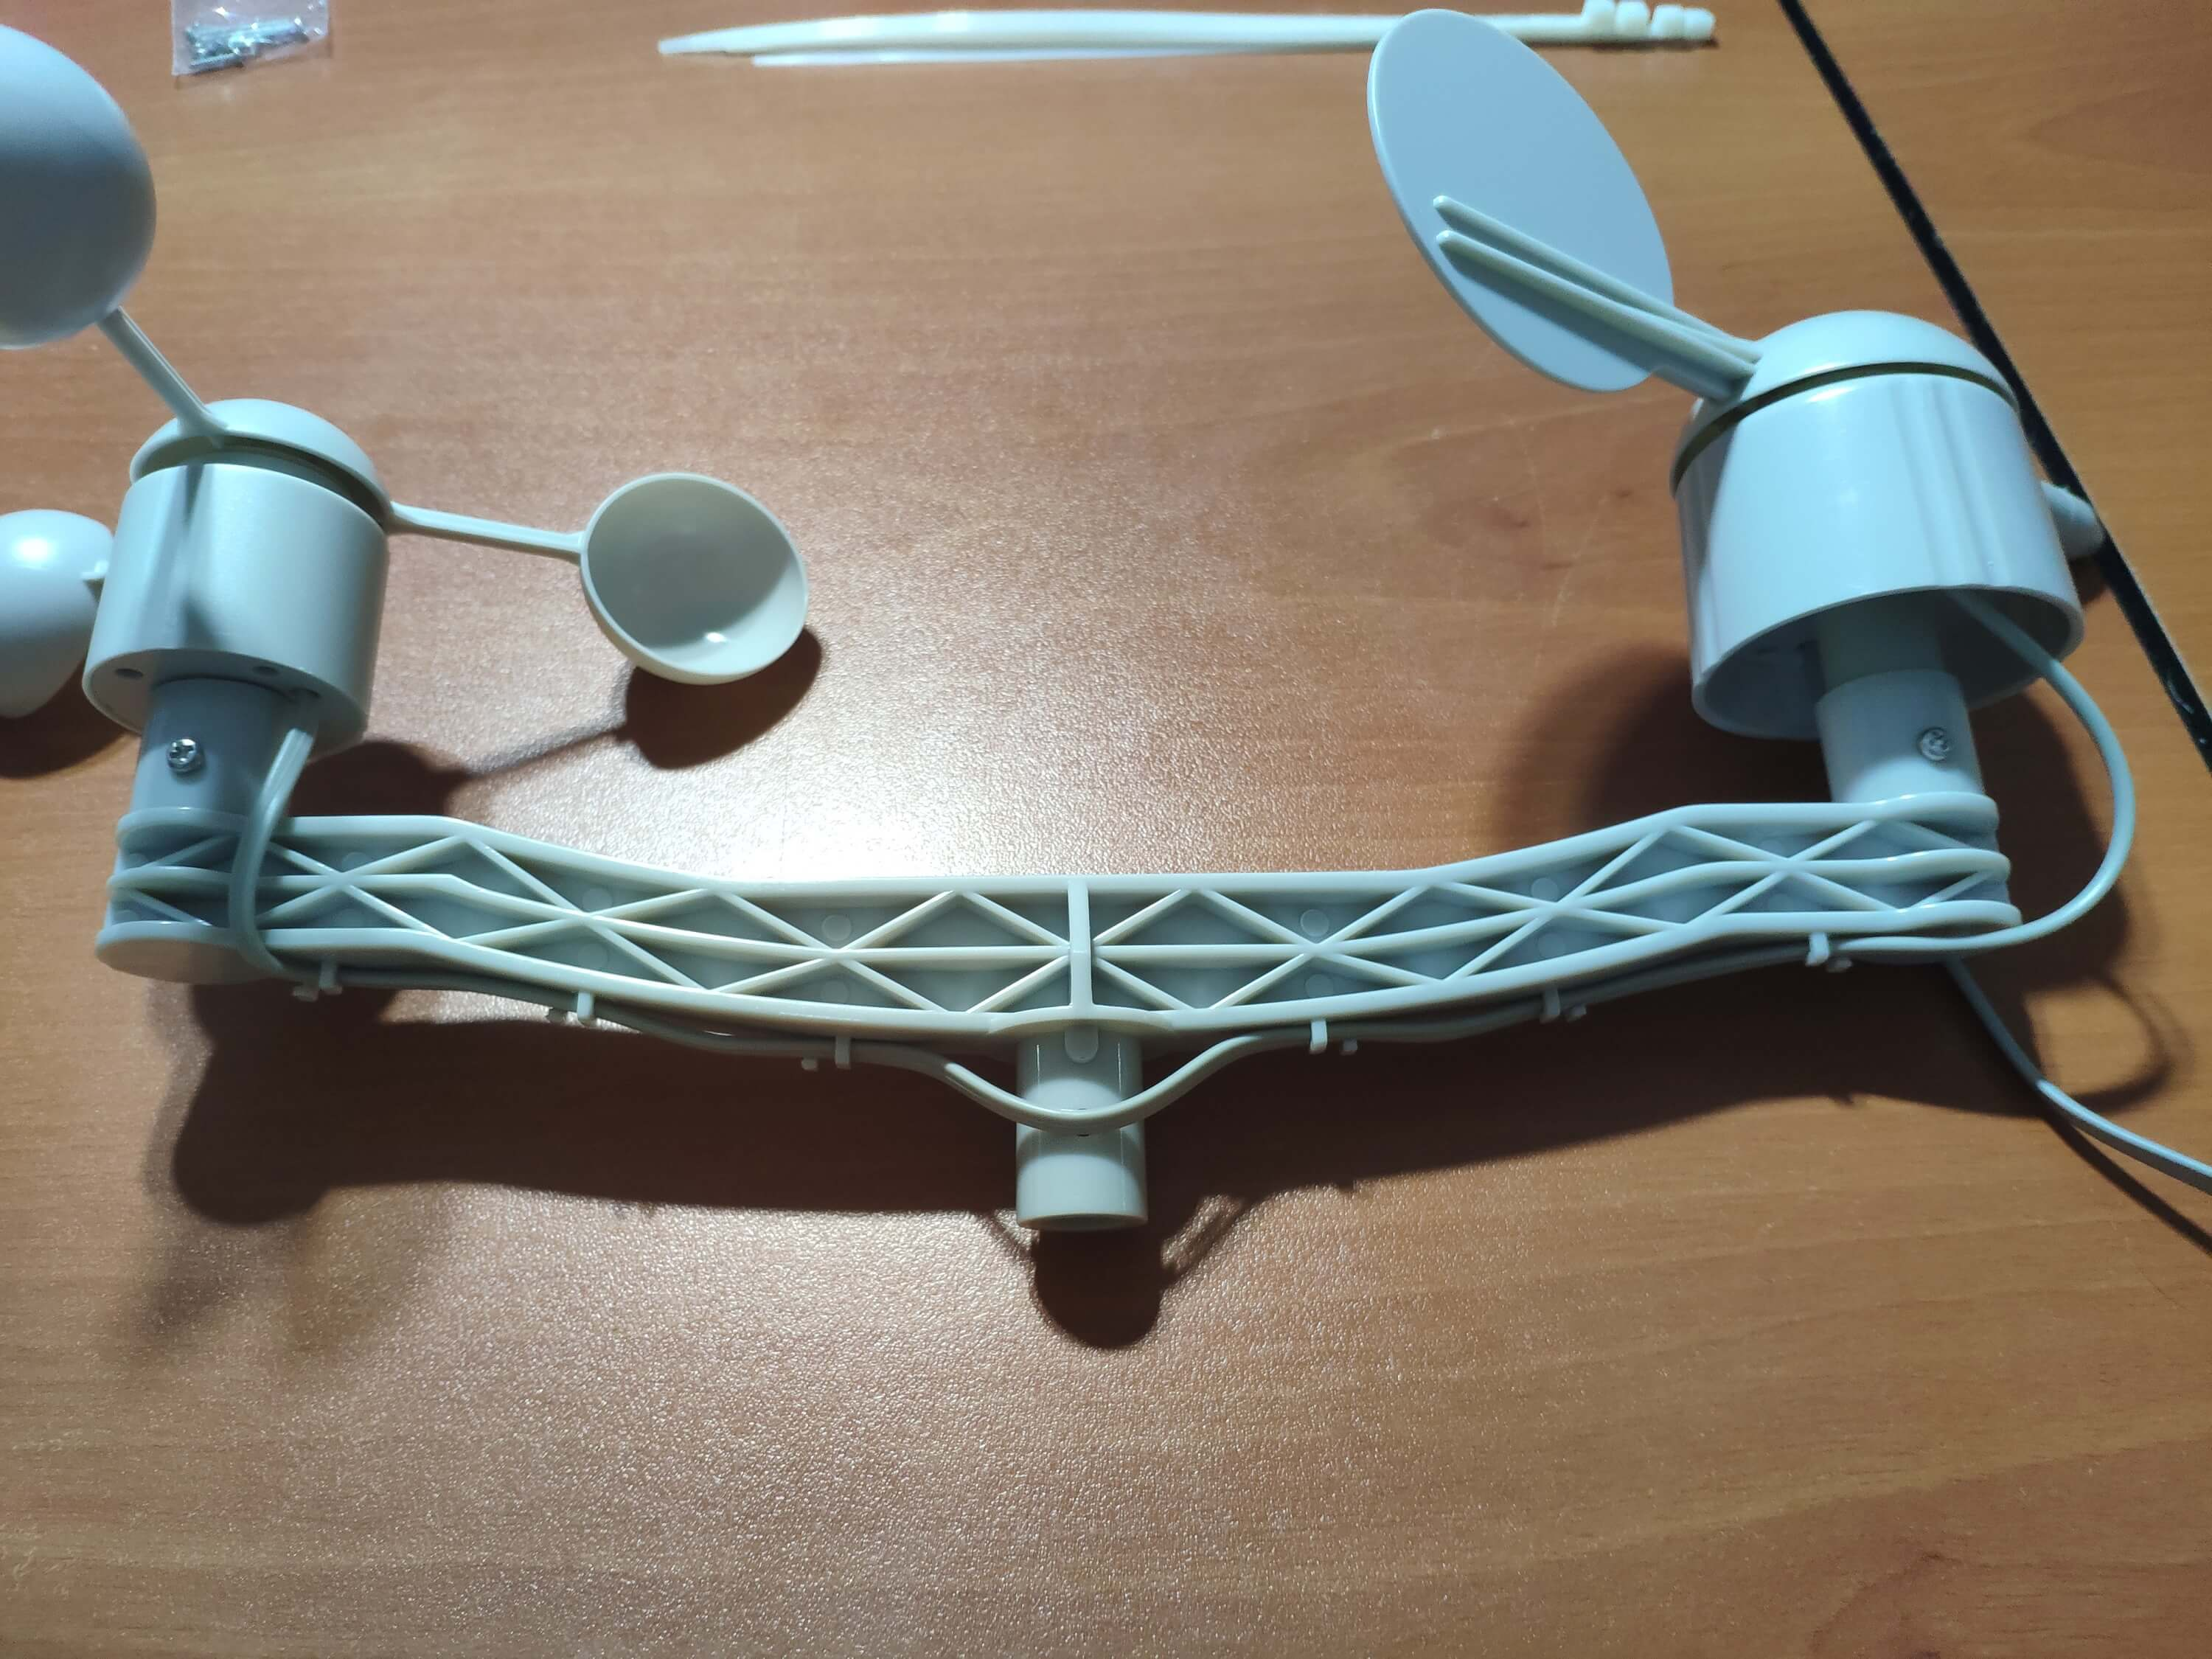
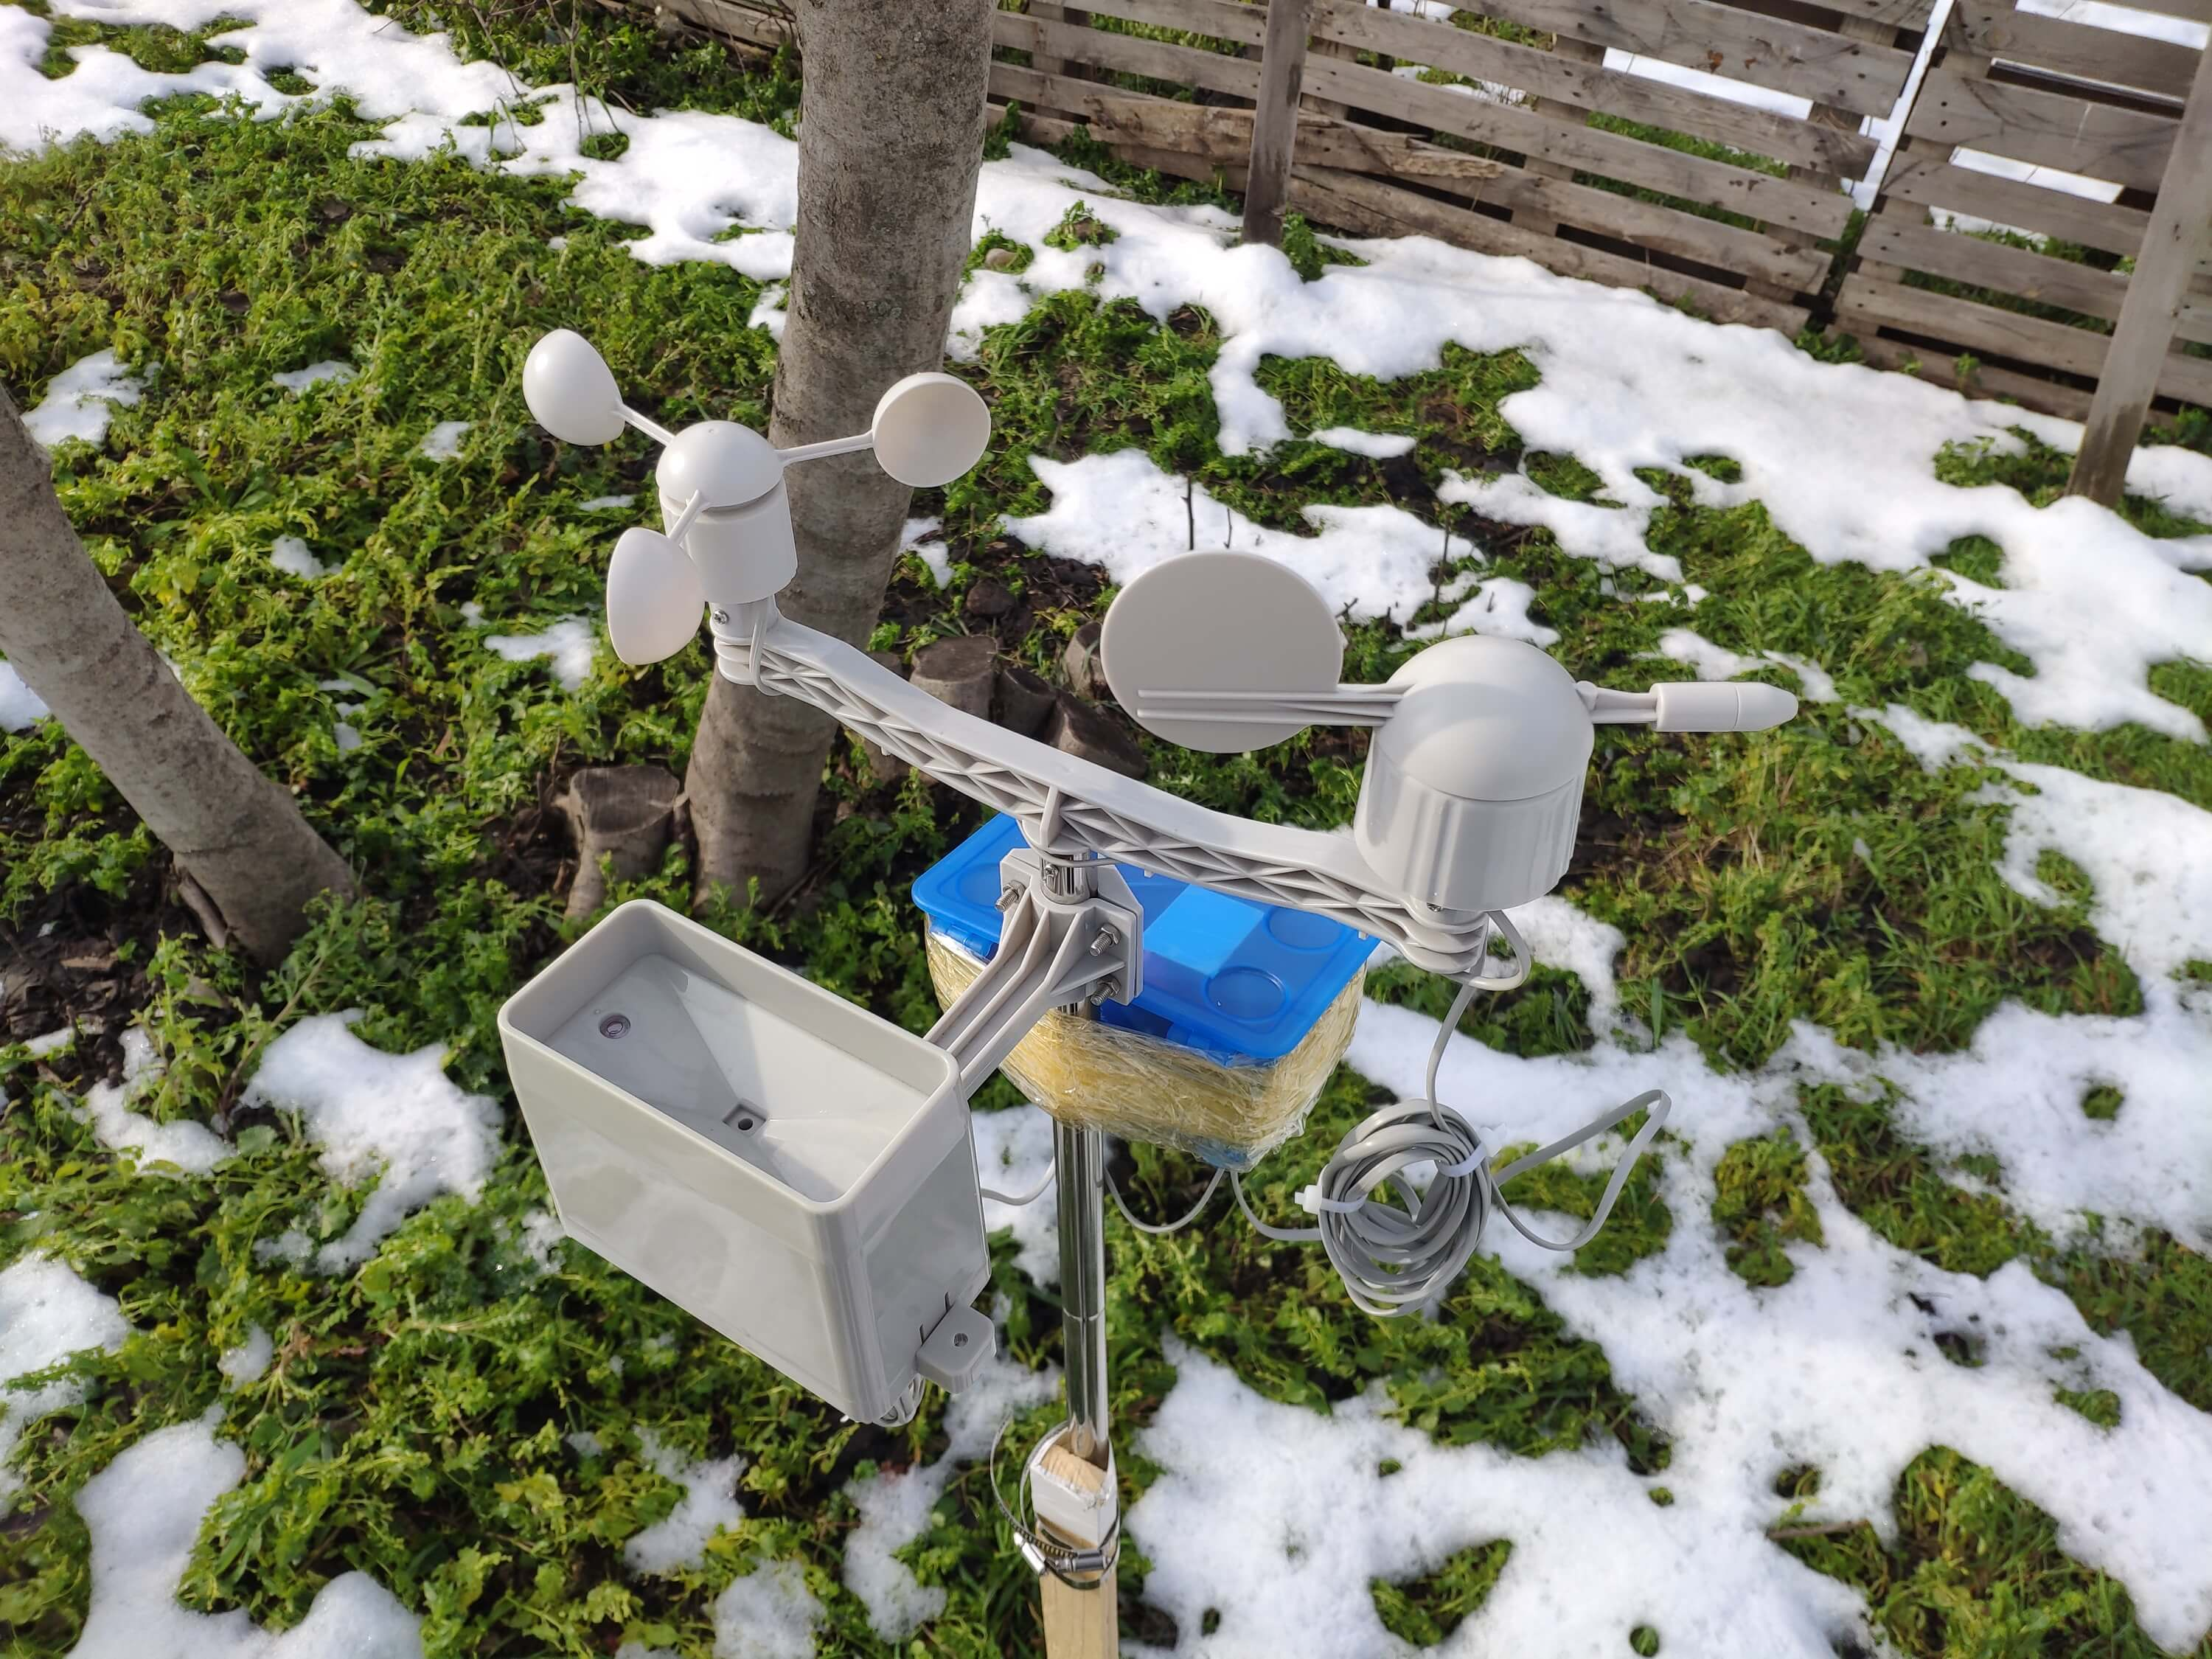
Langkah 1:Merakit kit stasiun cuaca dengan anemometer, baling-baling angin, dan ember hujan
Kit stasiun cuaca ini mencakup anemometer, anggur angin, ember hujan, dan papan sensor untuk mengirim data cuaca melalui protokol komunikasi serial. Dengan demikian, mudah digunakan dengan papan pengembangan untuk mengumpulkan data cuaca lokal.
Ini menghasilkan 37 byte per detik, termasuk akhir CR/LF .
c000s000g000t086r000p000h53b10020
Pengurai Data:
- c000 arah udara, derajat
- s000 kecepatan udara (rata-rata), 0,1 mil per jam
- g000 kecepatan udara (maks), 0,1 mil per jam
- t086 suhu, Fahrenheit
- r000 curah hujan (1 jam), 0,01 inci
- p000 curah hujan (24 jam), 0,01 inci
- h53 kelembaban, % (00%=100)
- b10020 atmosfer, 0,1 hPa
Pertama-tama, pasang anemometer dan baling-baling angin ke jembatan dengan menggunakan sekrup dan mur.
Hubungkan baling-baling angin ke anemometer dengan menggunakan kabel telepon RJ11 dan kencangkan di bawah jembatan.
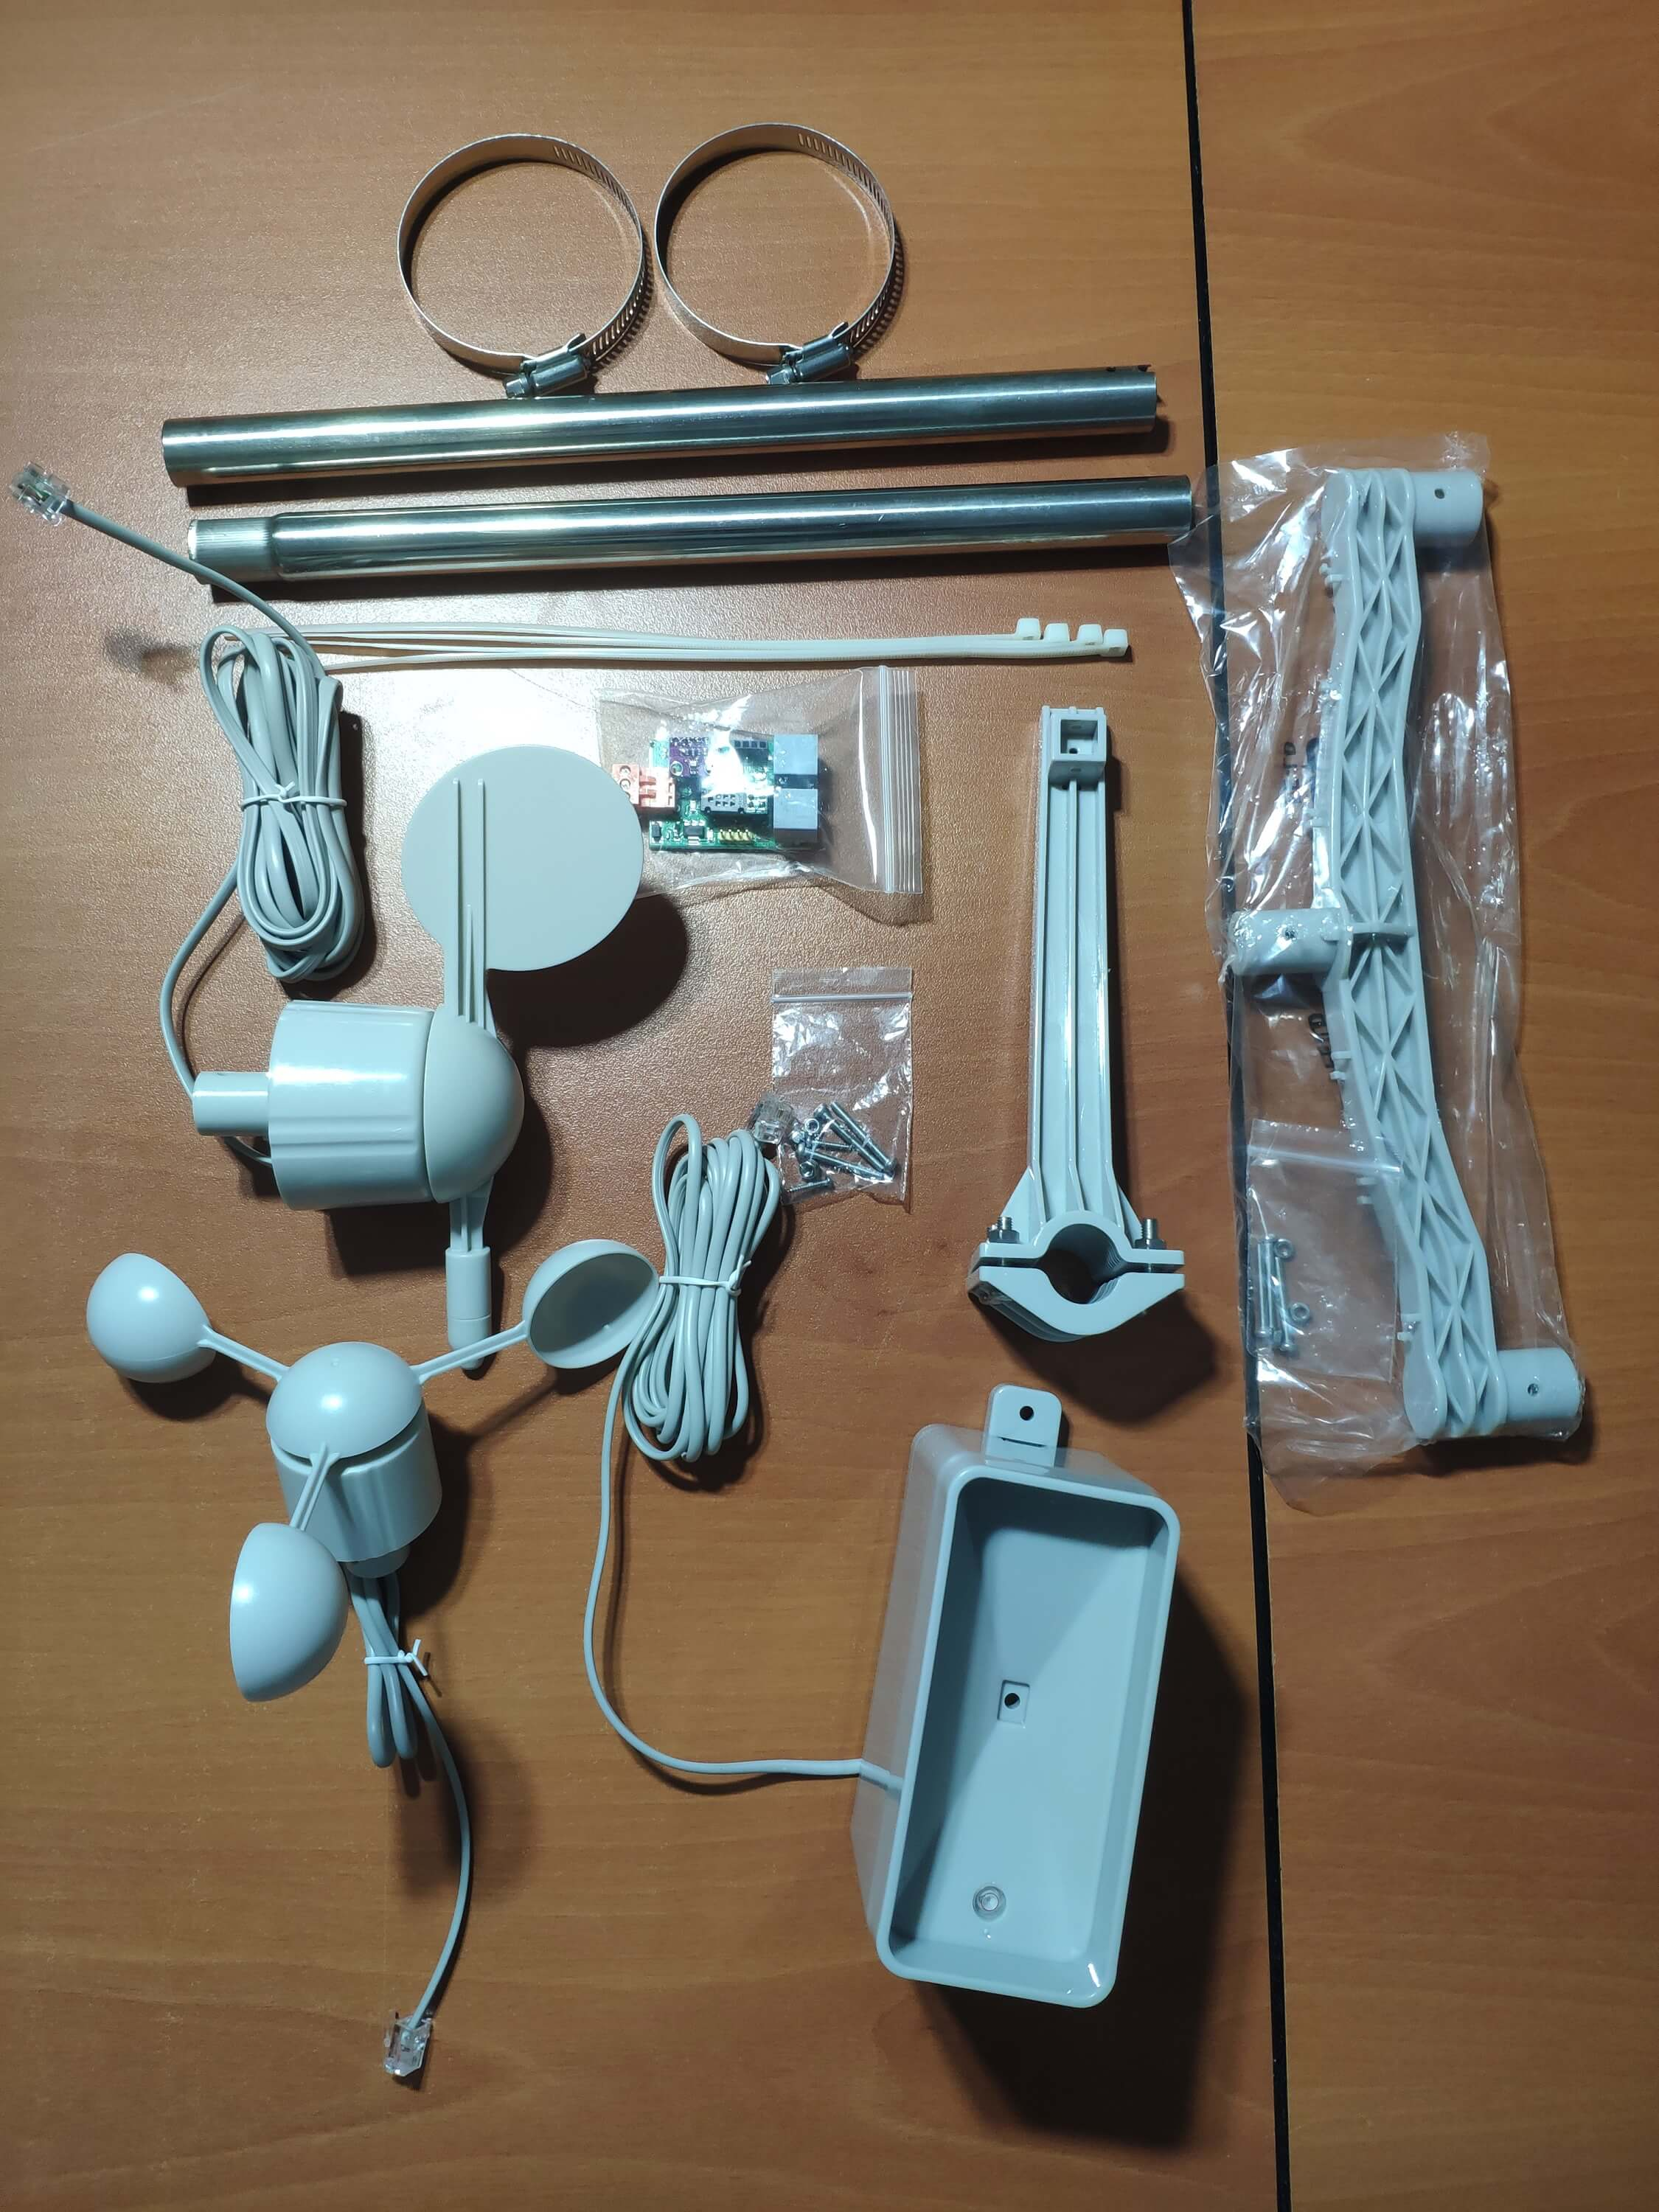
Kemudian, pasang tongkat baja tahan karat ke jembatan dengan sekrup.
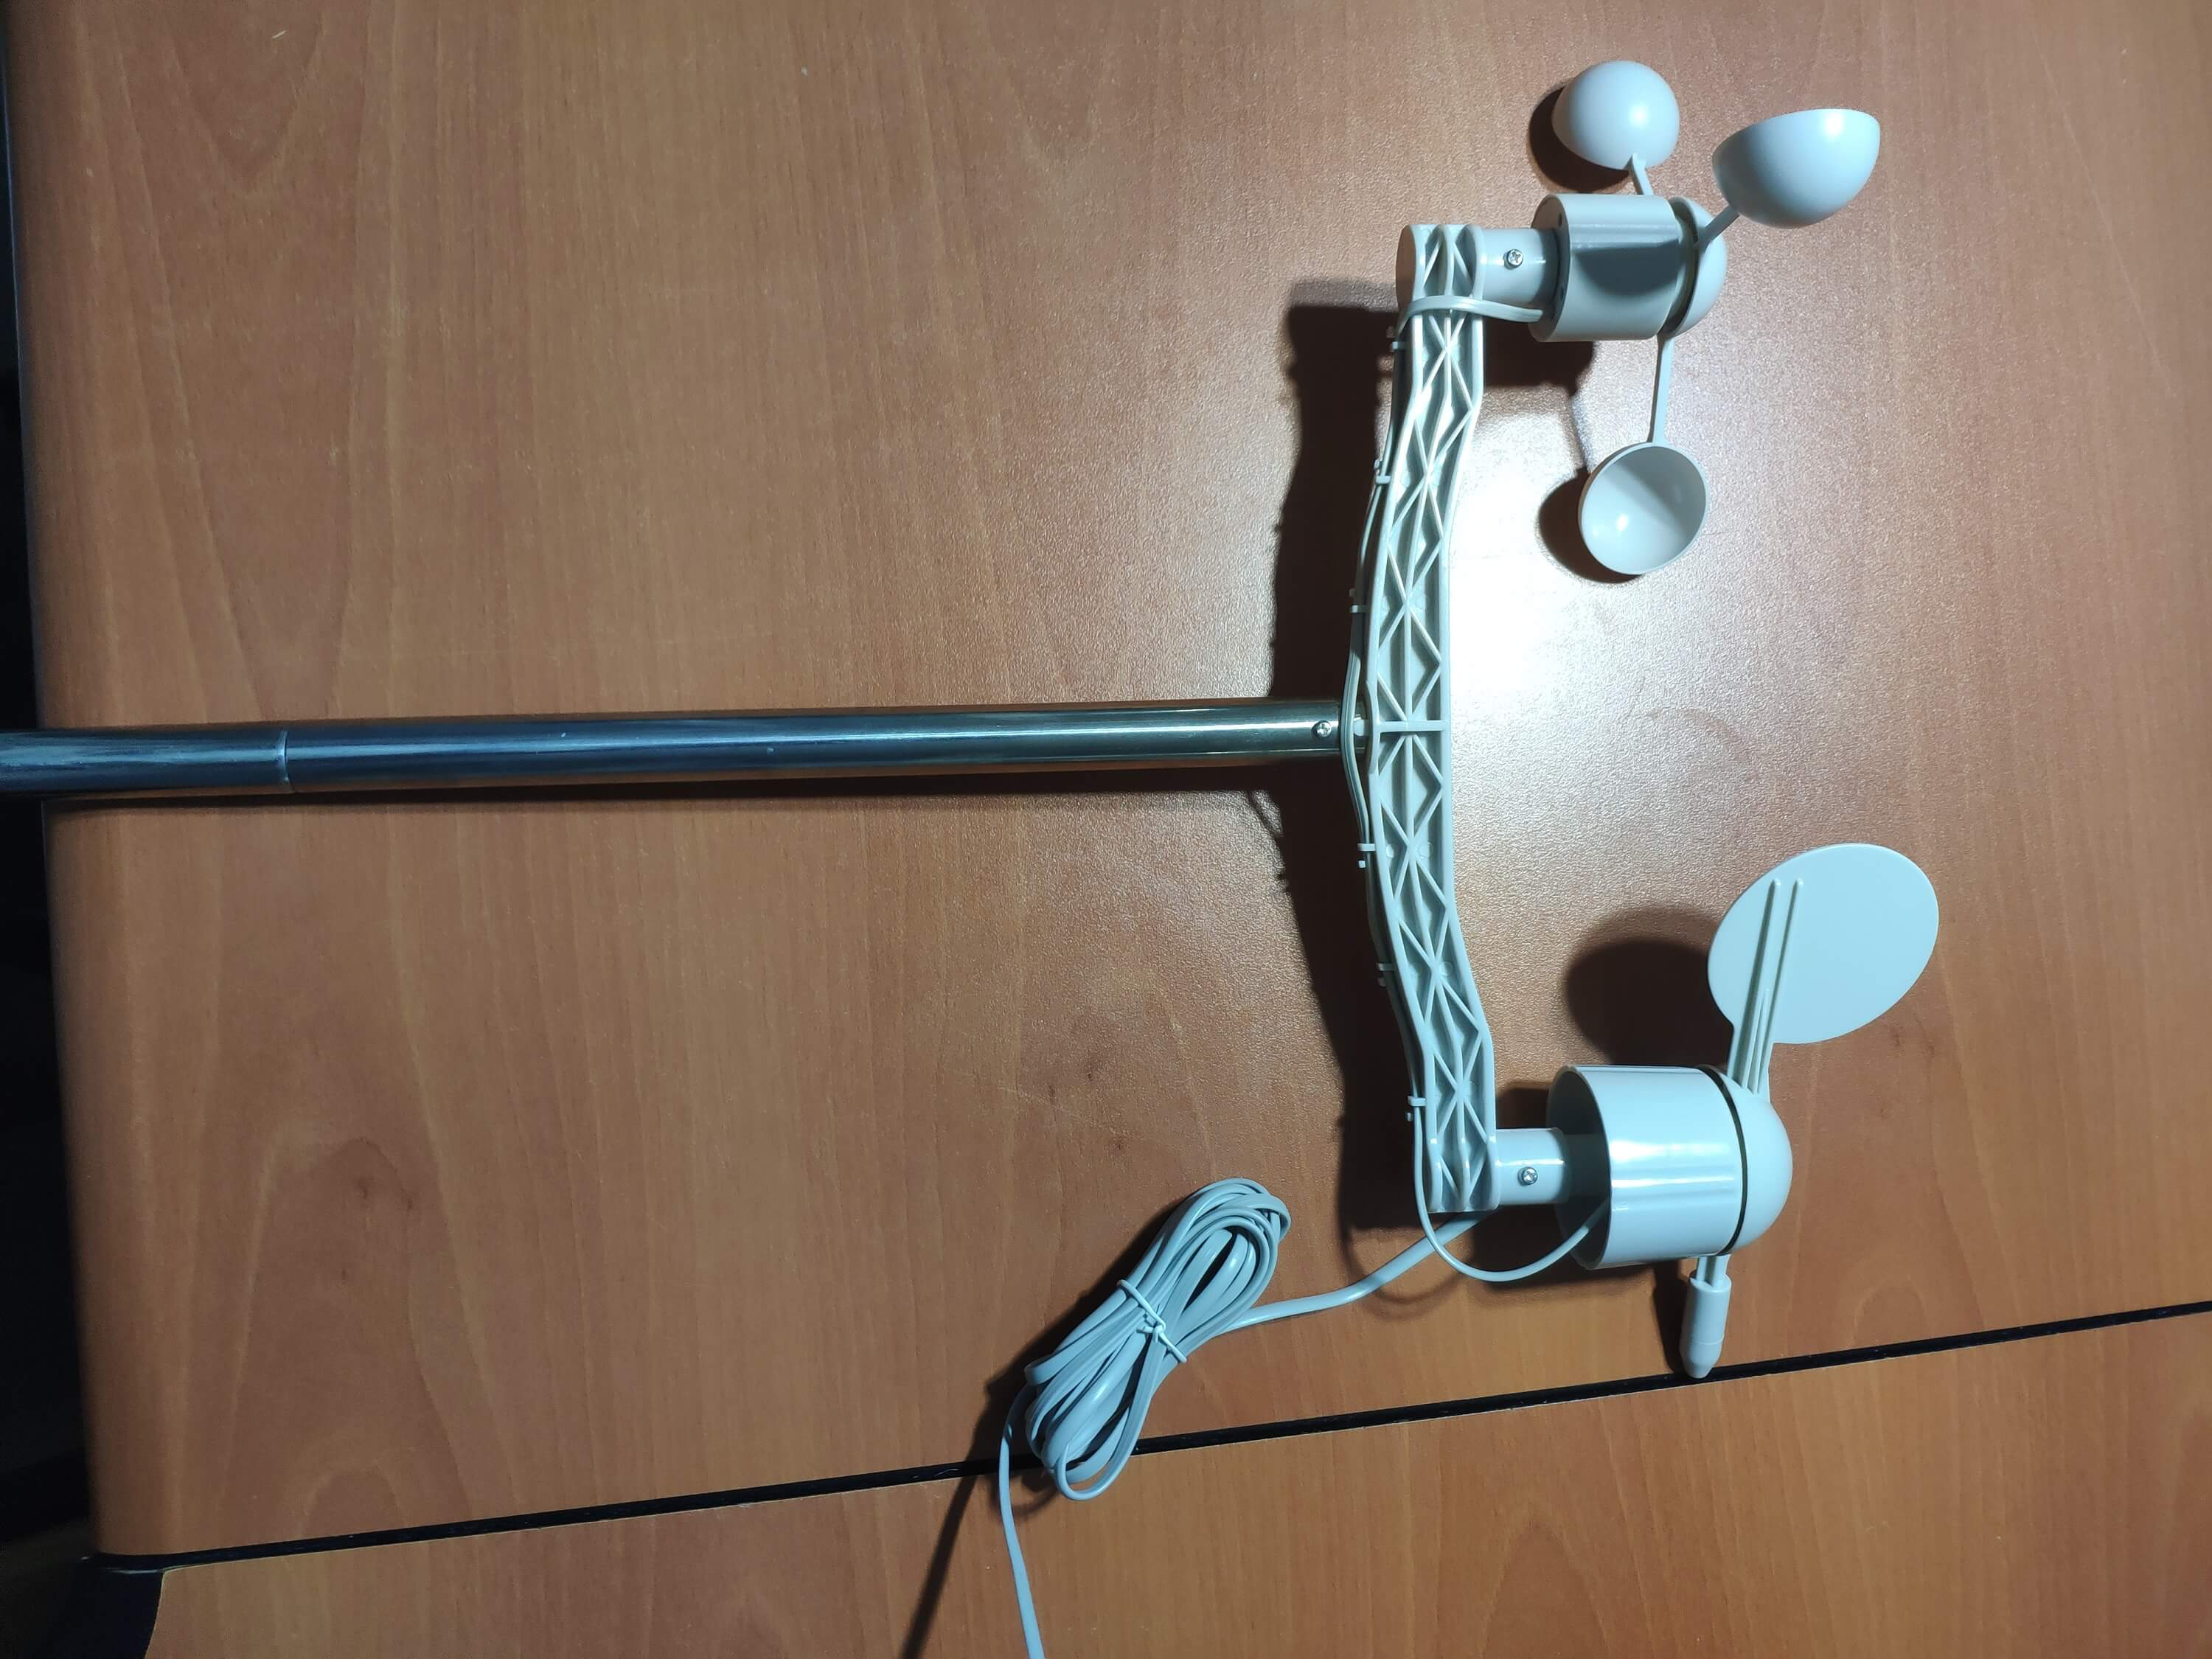
Pasang sambungan ember hujan di bawah ember hujan dengan sekrup.
Terakhir, letakkan ember hujan di atas stik stainless steel dengan menggunakan sekrup dan mur.
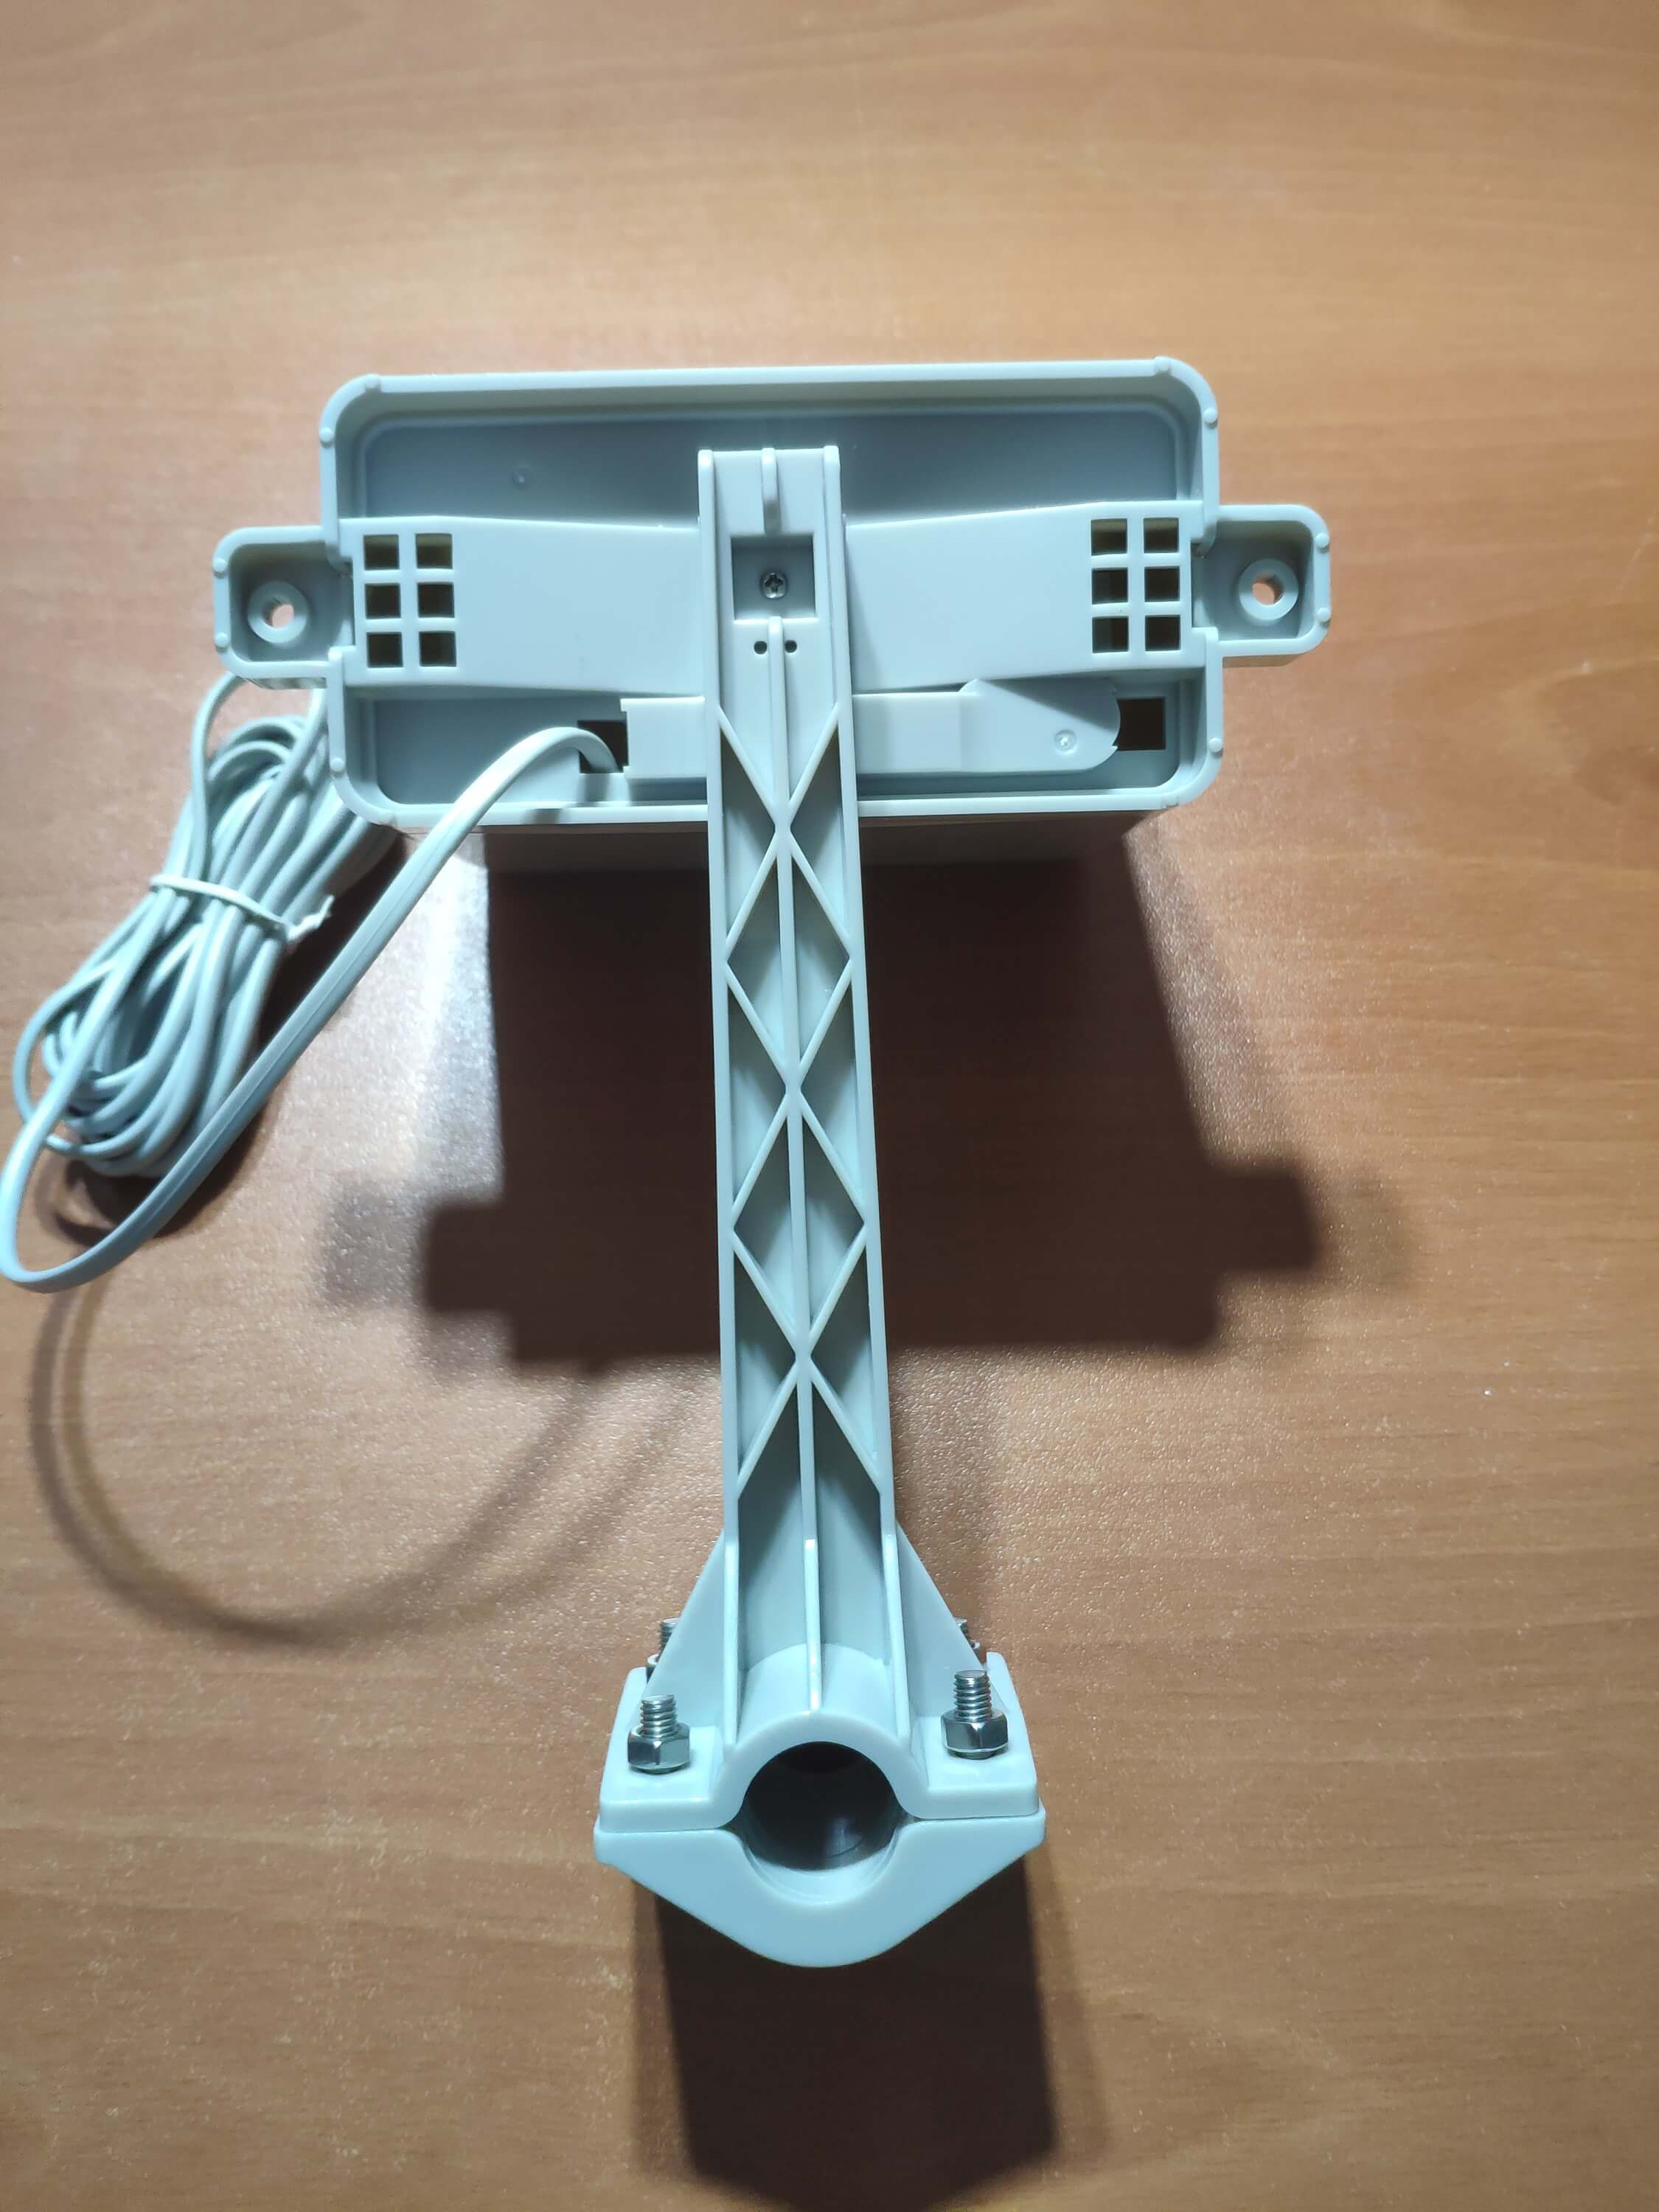
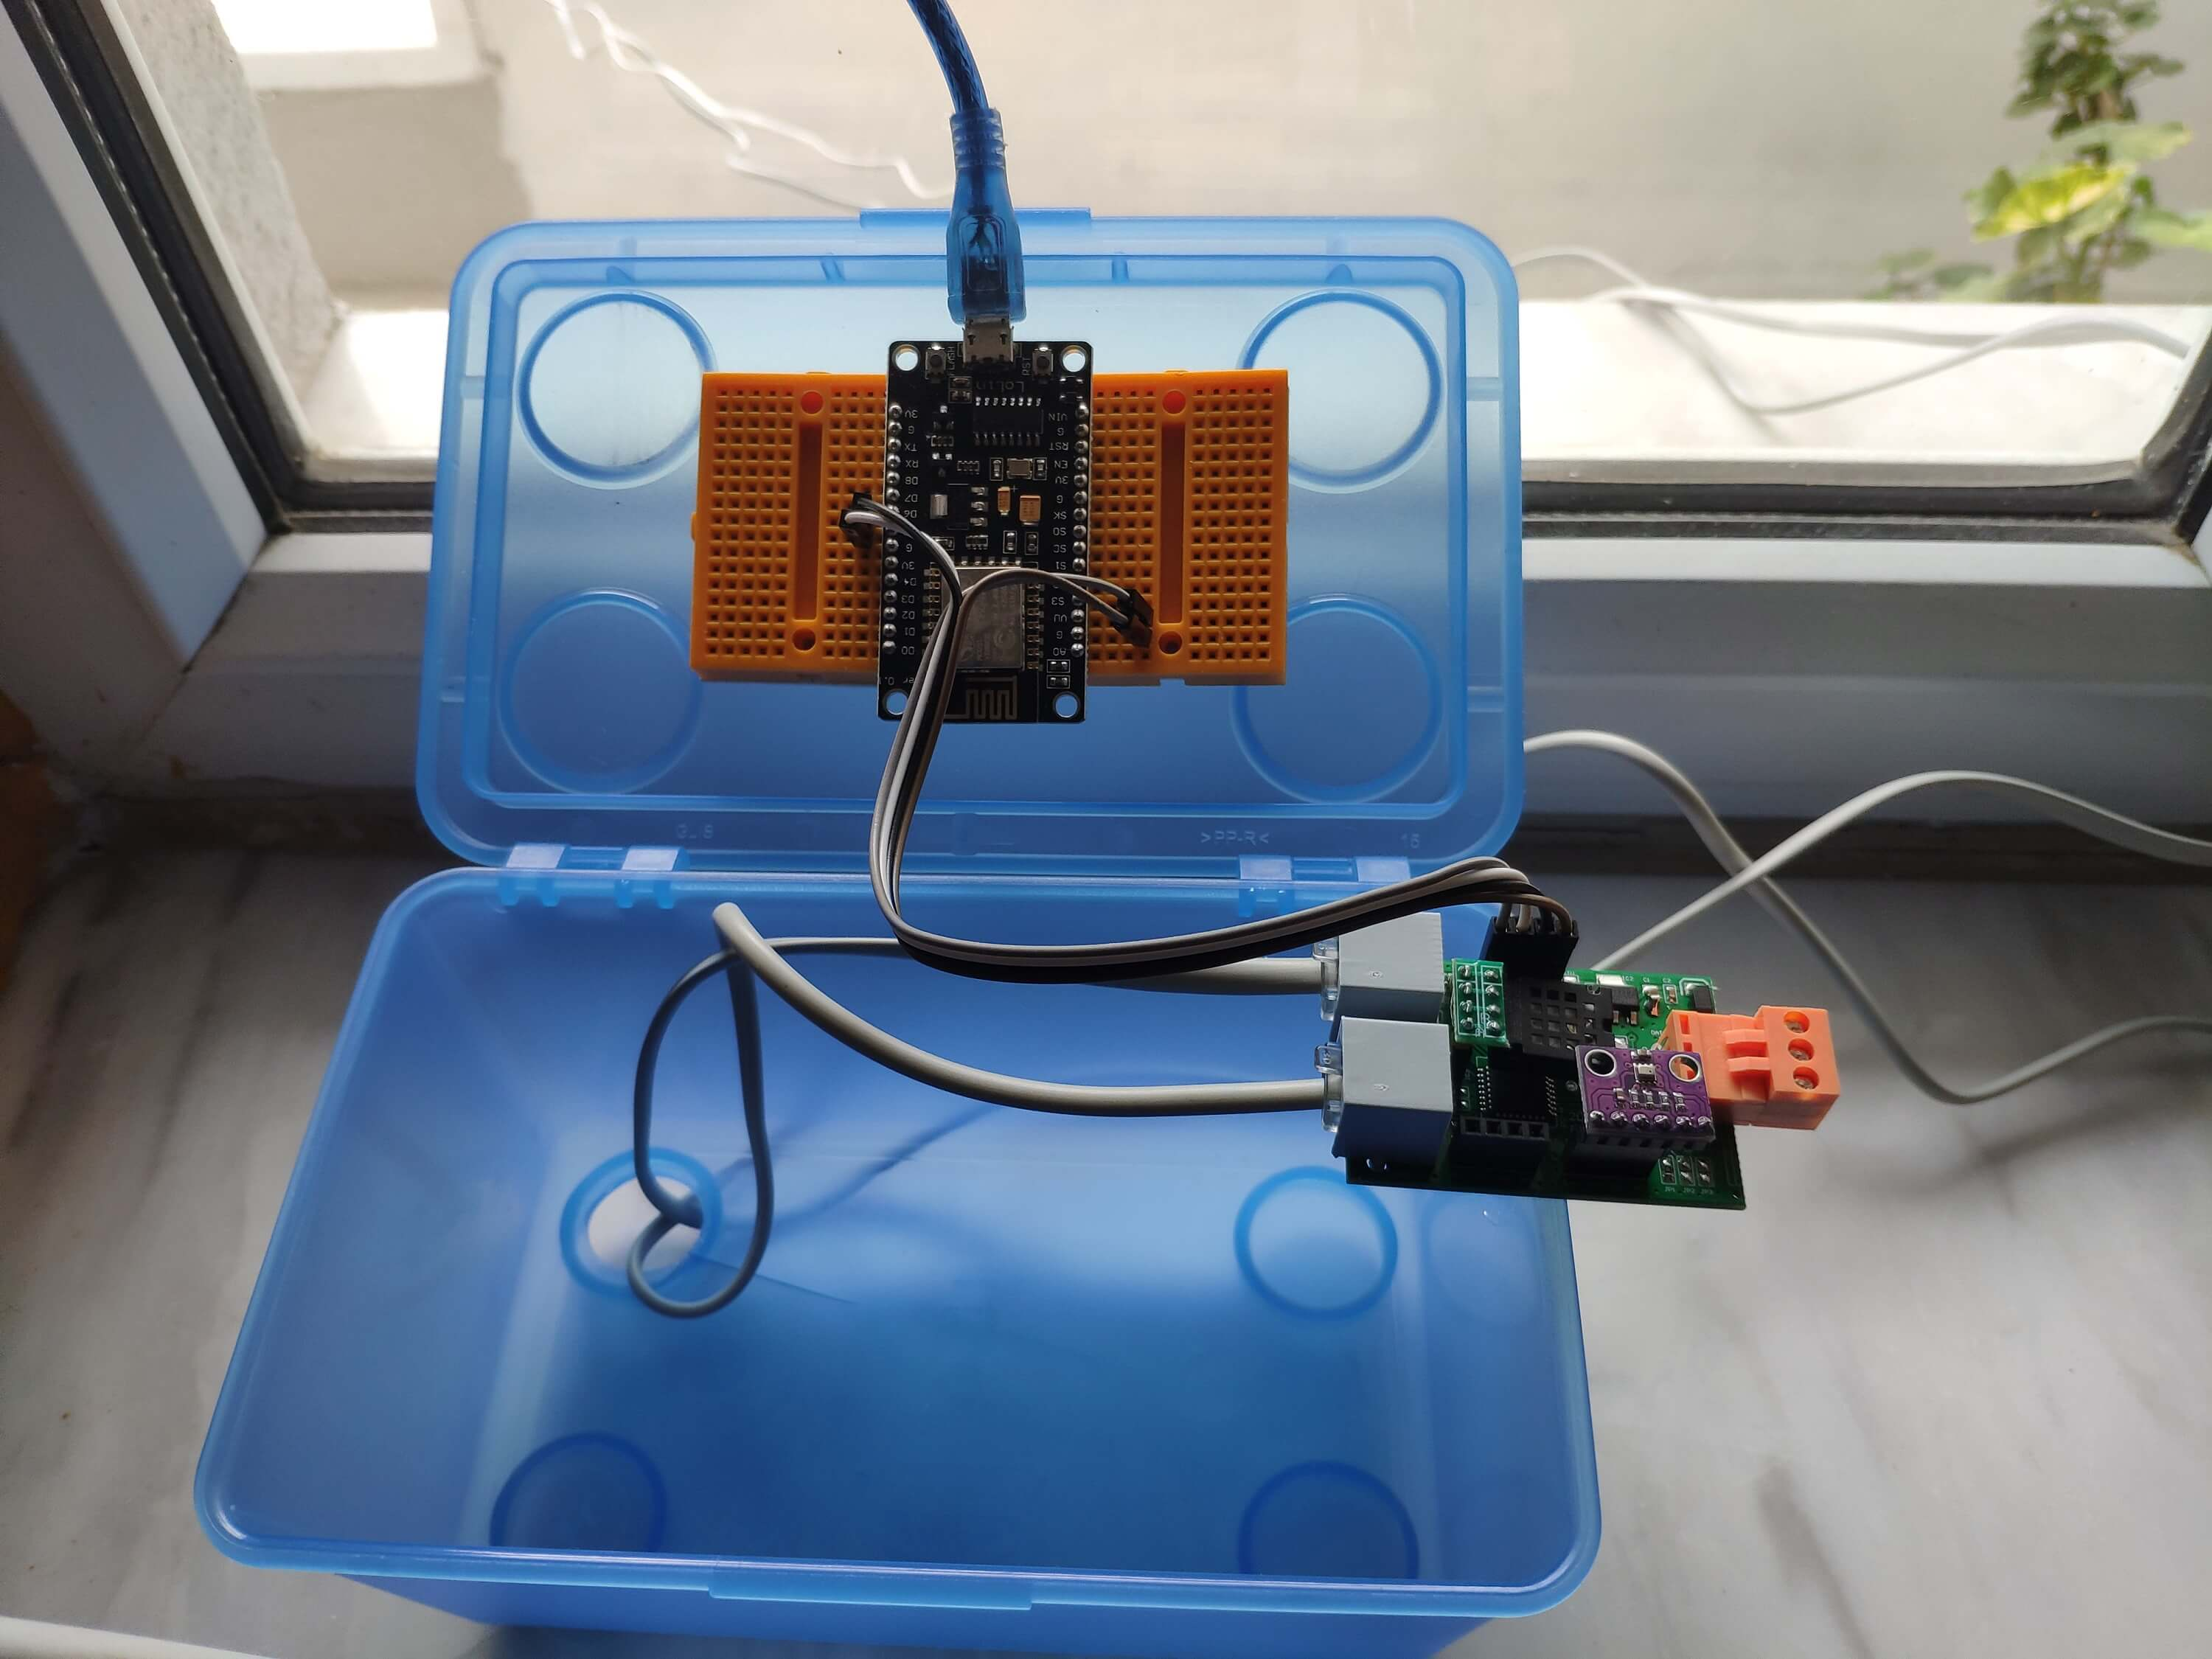
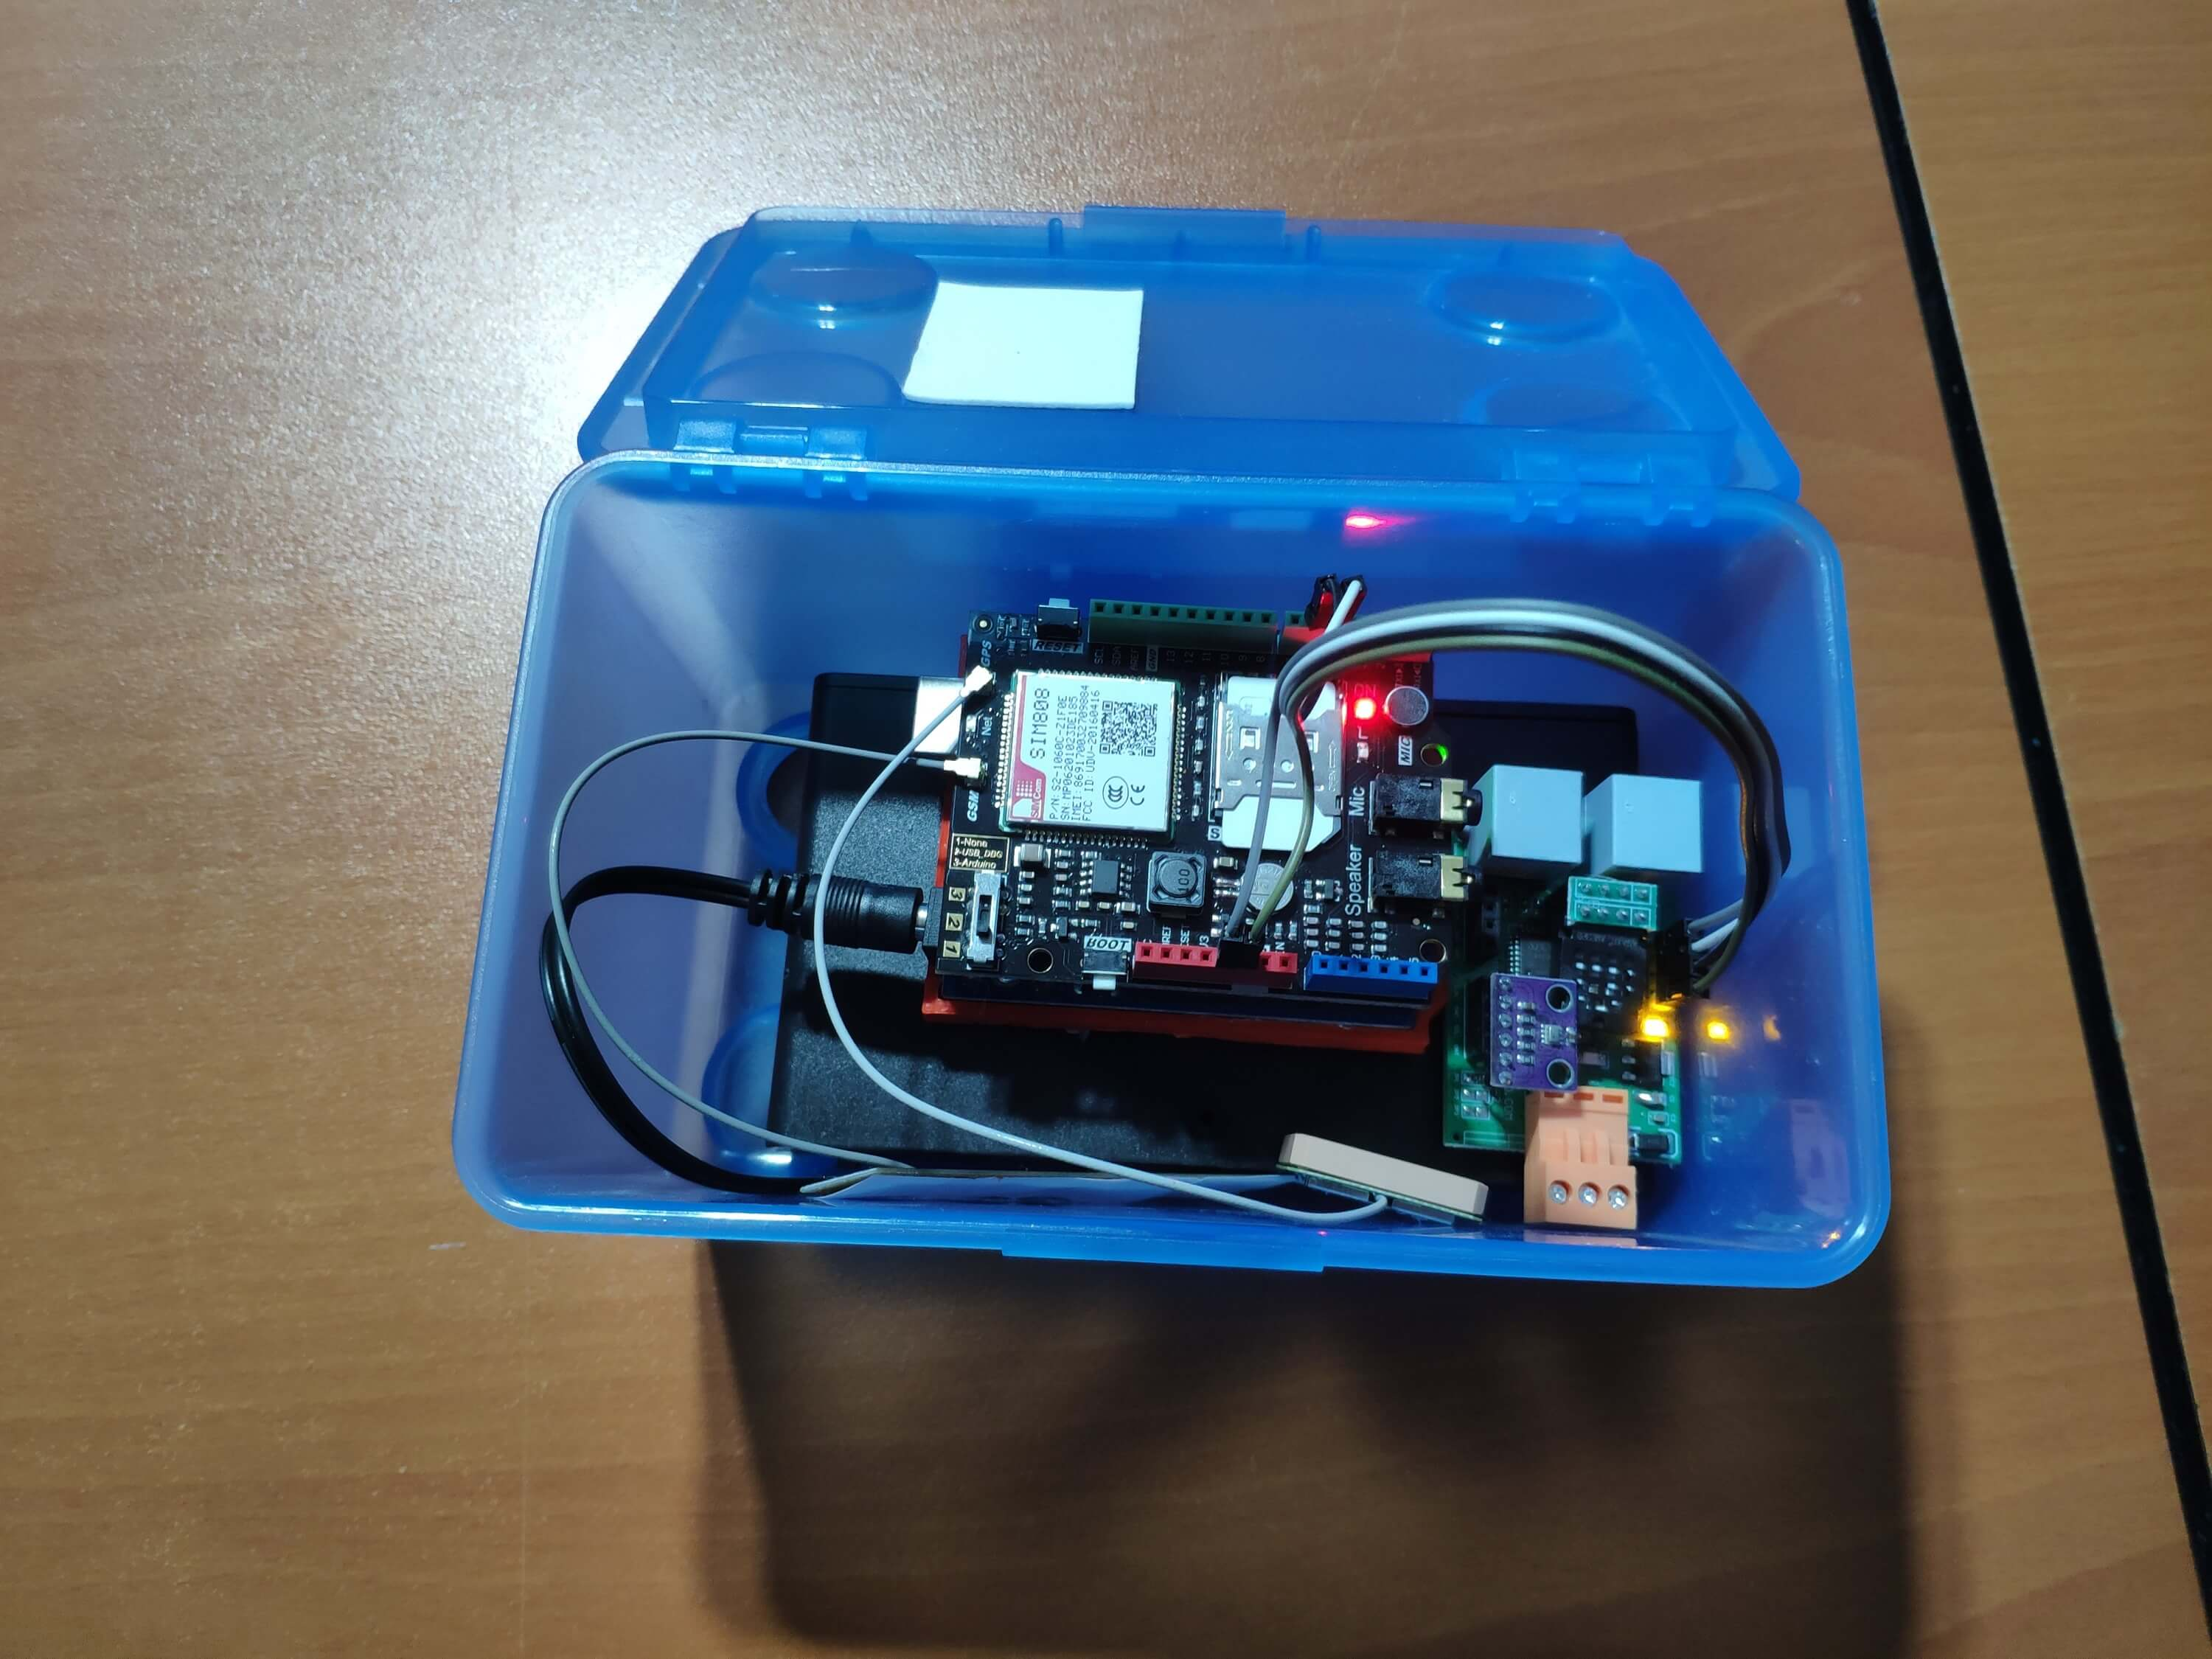
Sekarang, siap untuk mengumpulkan data cuaca bahkan dalam kondisi cuaca ekstrim. Namun, papan sensor (konverter) tidak tahan cuaca, jadi saya menambahkan kotak plastik ke stasiun cuaca untuk melindungi papan sensor dan pelindung SIM808 di luar ruangan.
Langkah 2:Mengumpulkan data cuaca di Google Spreadsheet
Untuk dapat mengirim informasi ke spreadsheet di Google Sheets, Anda perlu membuat aplikasi baru di Google Developer Console dan mendapatkan kredensial verifikasi untuk menggunakan Google Sheets API. Jika Anda seorang pemula dalam membuat aplikasi dengan Google Developer Console, ikuti petunjuk di bawah ini.
Buka Google Developer Console dan klik tombol 'PROYEK BARU'. Masukkan nama proyek sebagai Stasiun Cuaca Jarak Jauh .

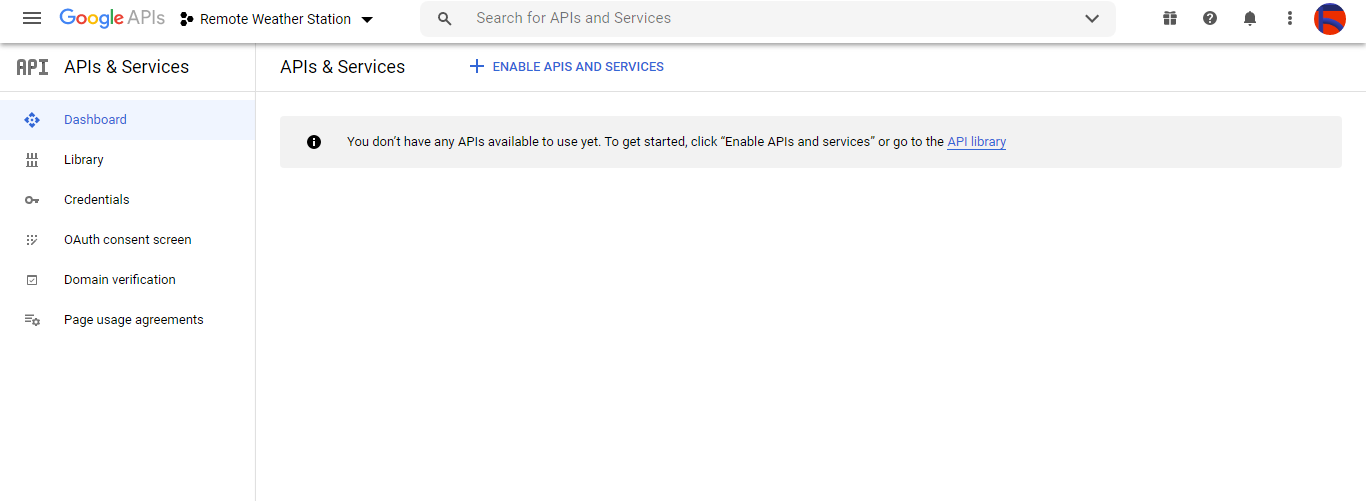
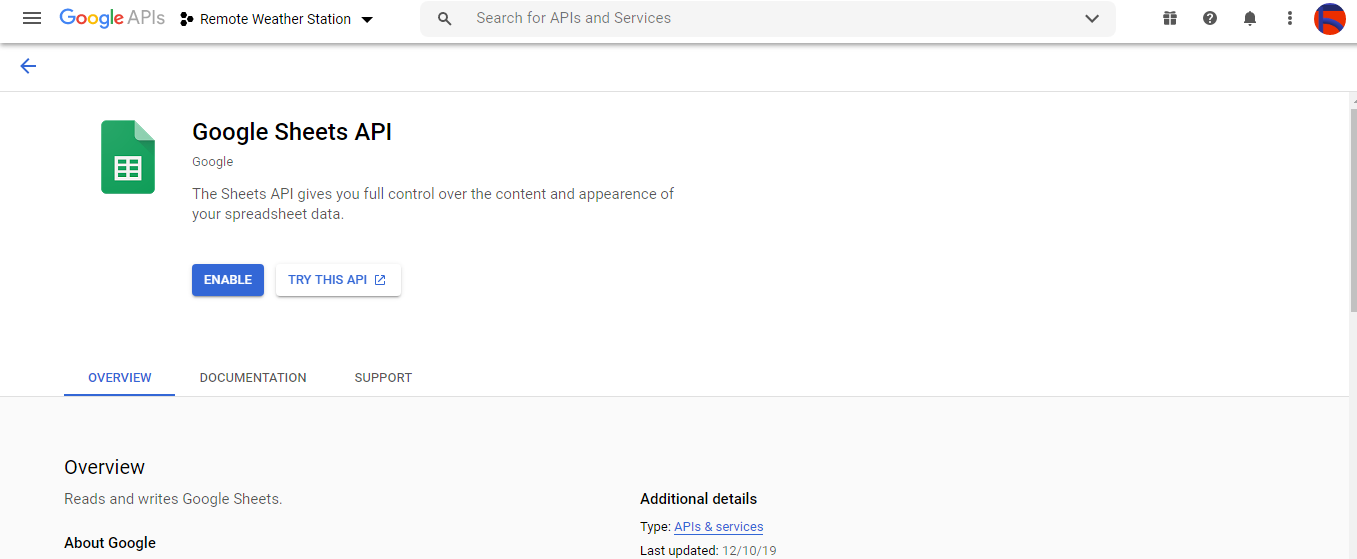
Buka API &Layanan dan klik ke perpustakaan API untuk mengaktifkan Google Sheets API.
Langkah 2.1:Mendapatkan kredensial untuk menggunakan Google Sheets API
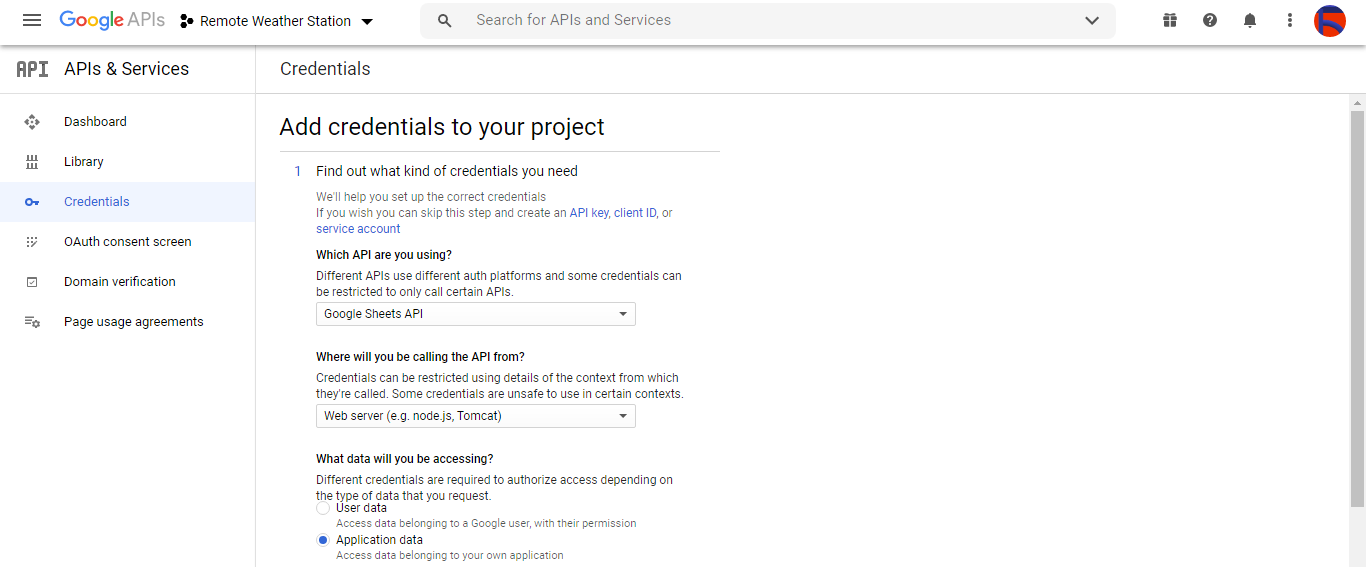
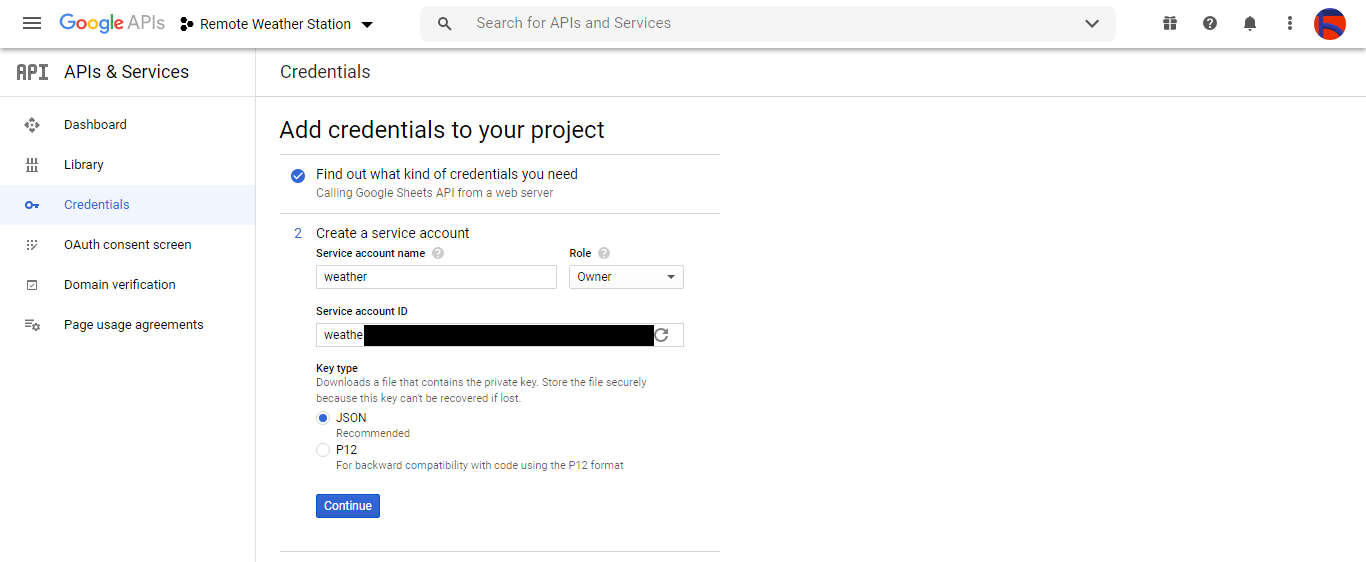
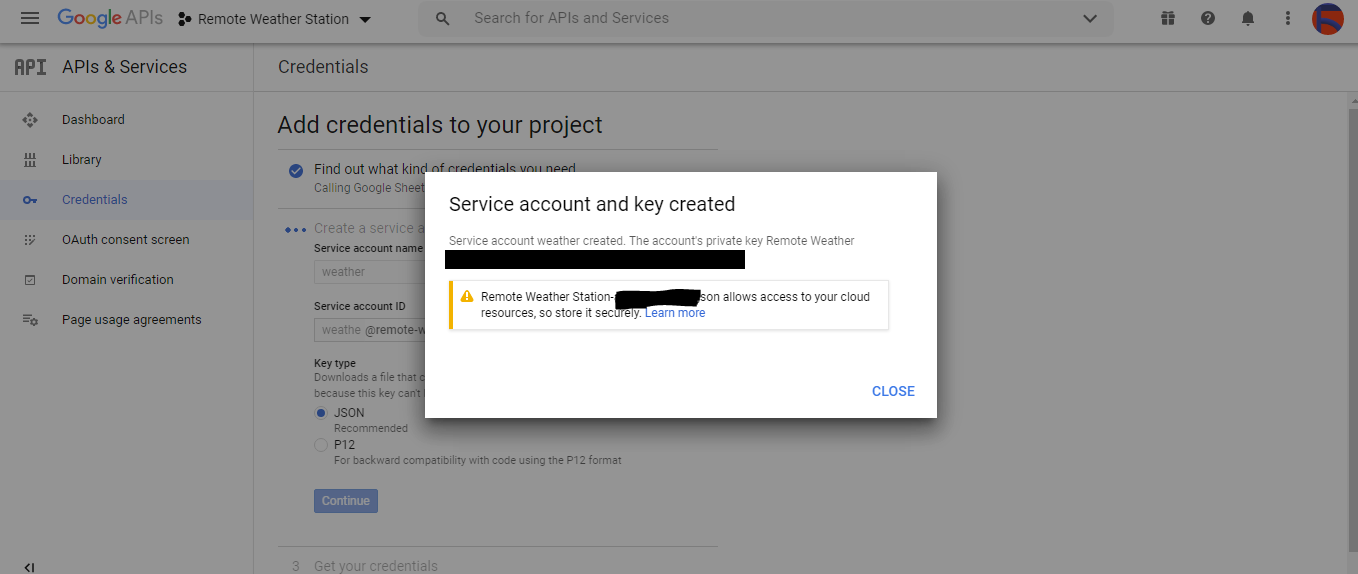
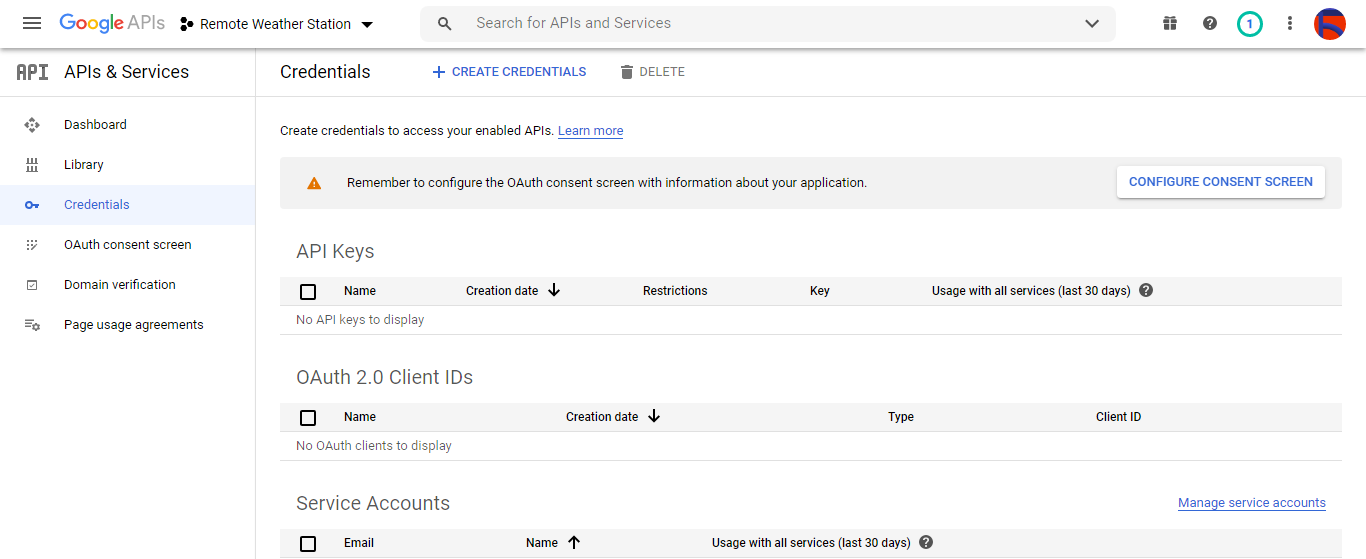
Buka dasbor proyek dan klik Kredensial tombol. Kemudian, isi formulir seperti yang digambarkan di bawah ini untuk membuat akun dan kunci layanan.
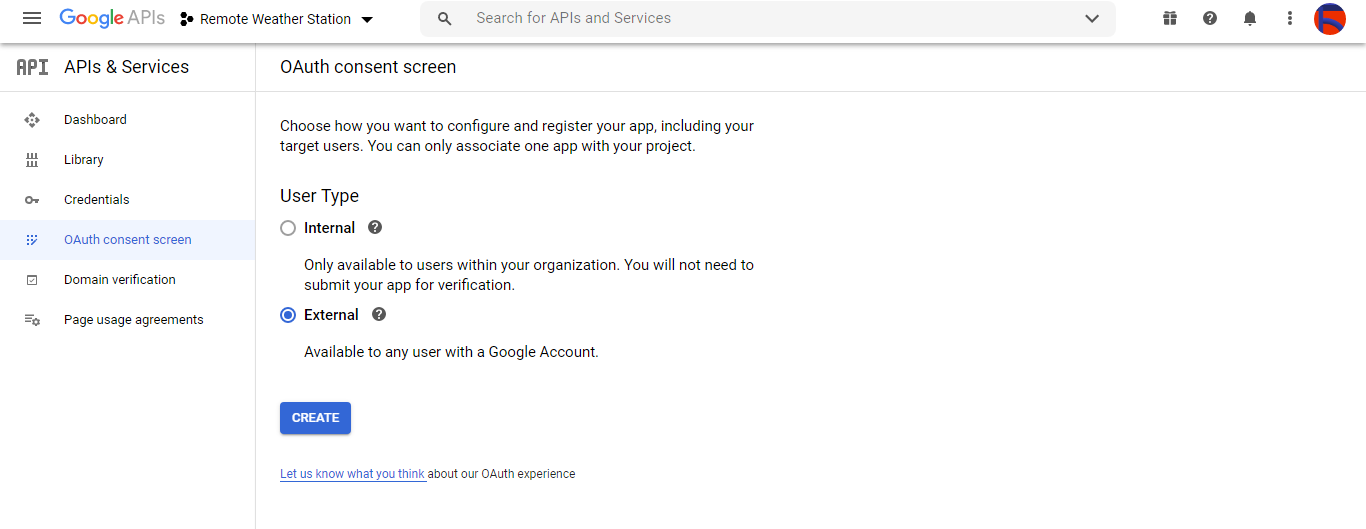
Klik BUAT KREDENSIAL dan konfigurasikan layar persetujuan agar dapat membuat ID klien OAuth.
Kemudian, buat ID klien OAuth baru bernama Klien di bawah Aplikasi desktop (jenis aplikasi).
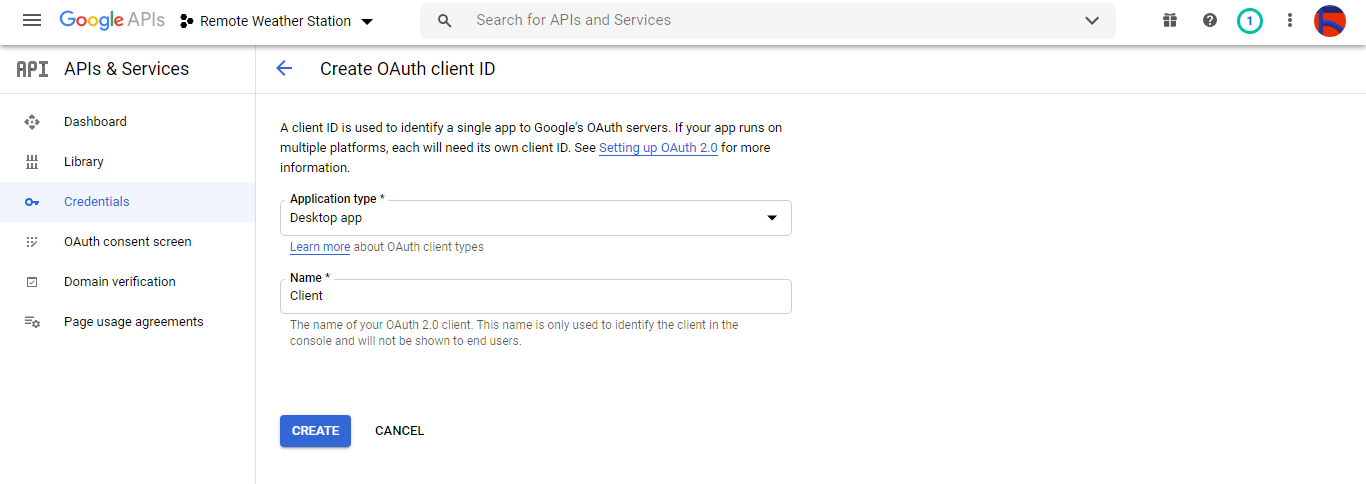
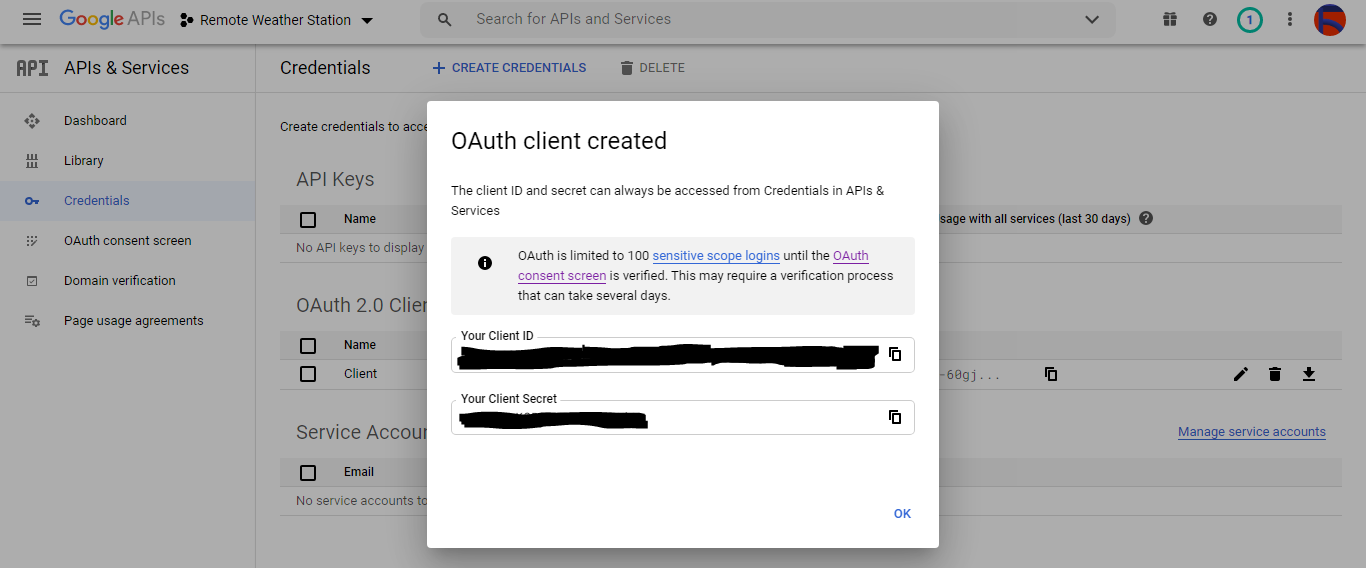
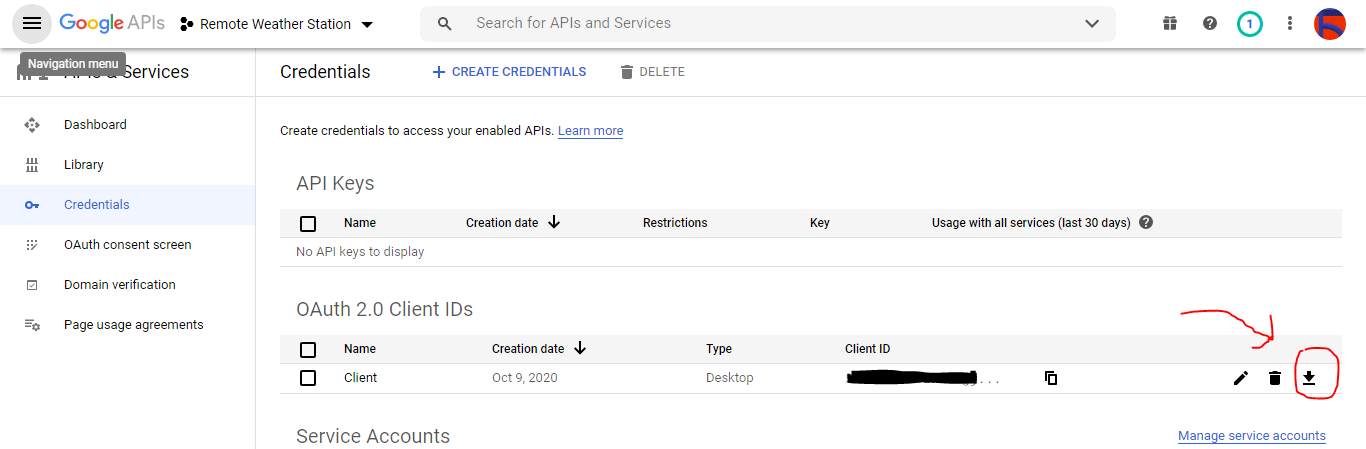
Setelah membuat ID klien OAuth (Klien) unduh kredensial (ID dan Rahasia) dan beri nama file sebagai credentials.json .
Langkah 2.2:Membuat spreadsheet di Google Spreadsheet
Buka Google Spreadsheet dan pilih Pribadi .

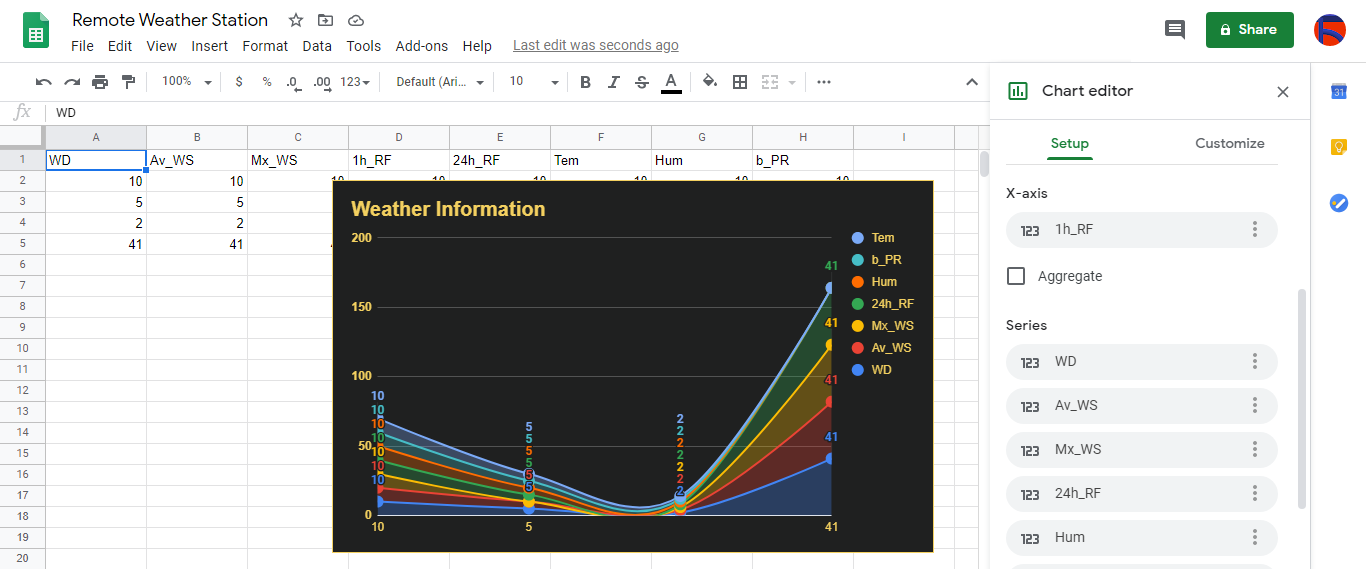
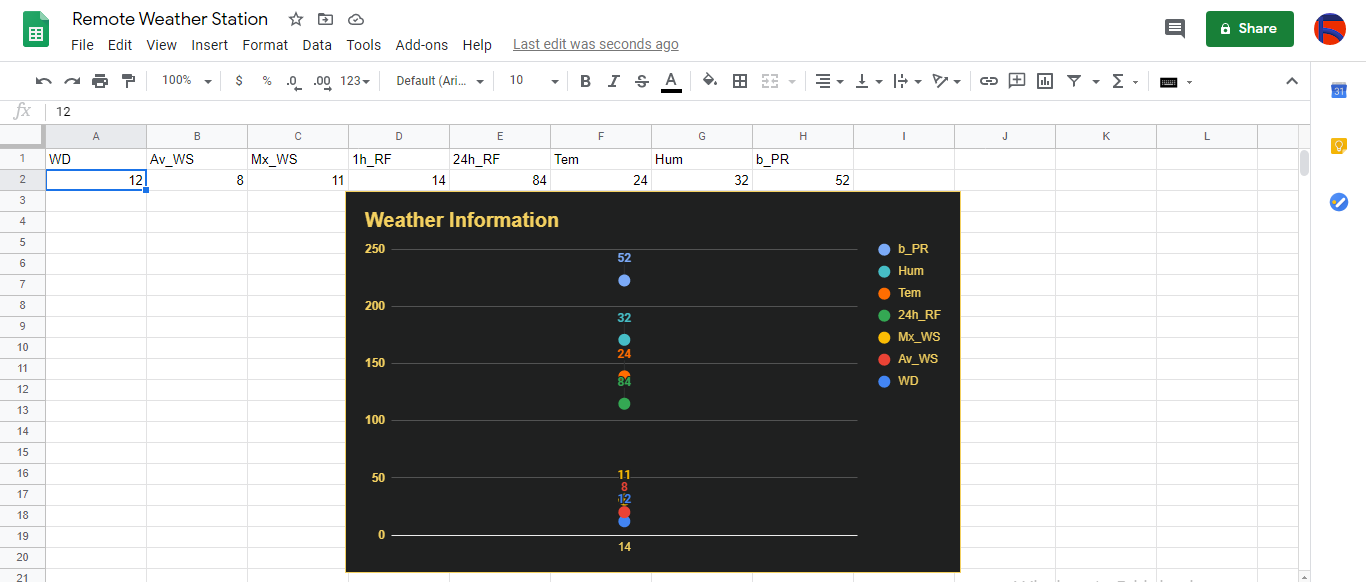
Buat Kosong spreadsheet dan beri nama Stasiun Cuaca Jarak Jauh .
Kemudian, tentukan nama kolom sebagai baris pertama:
- WD
- Av_WS
- Mx_WS
- 1j_RF
- 24 jam_RF
- Tem
- Hum
- b_PR
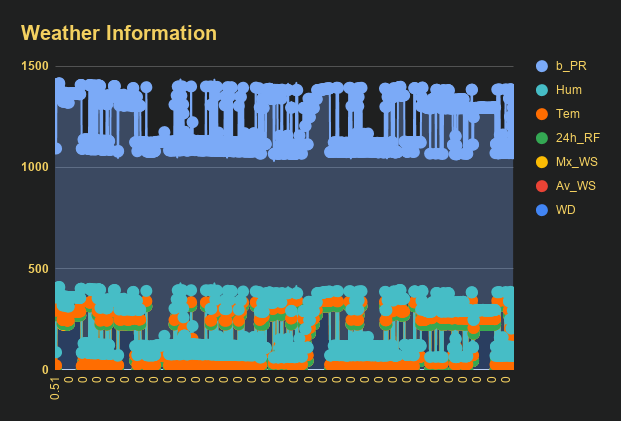
Jika perlu, ubah bagan untuk memeriksa data yang dikumpulkan, seperti yang saya lakukan.
Langkah 3:Mengembangkan aplikasi web di PHP untuk menambahkan data cuaca ke spreadsheet
Aplikasi web PHP ini untuk mendapatkan data cuaca yang ditransfer oleh papan pengembangan (ESP8266 dan SIM808) melalui permintaan Dapatkan HTTP dan menambahkan data tersebut ke spreadsheet tertentu (berdasarkan ID) di Google Spreadsheet dengan kredensial dan token yang diverifikasi.
Aplikasi web memerlukan Perpustakaan Klien Google untuk PHP untuk menambahkan data cuaca ke spreadsheet tertentu di Google Spreadsheet.
Jadi, pertama-tama, buat folder bernama remote_weather_station di server Anda dan instal Perpustakaan Klien Google untuk PHP di dalamnya.
stasiun cuaca_jauh folder harus menyertakan empat file ini selain Pustaka Klien Google agar berfungsi:
- index.php
- account_verification_token.php
- credentials.json (Langkah 2.1)
- token.json (Langkah 3.1)
Pada langkah ini, saya akan membahas dua file pertama - index.php dan account_verification_token.php:
index.php
Dapatkan data cuaca lokal dari stasiun cuaca melalui permintaan Dapatkan:
// Arah Angin (wd), Kecepatan Angin Rata-rata (a_ws), Kecepatan Angin Maks (m_ws), Curah Hujan 1 jam (1_rf), Curah Hujan 24 jam (24_rf), Suhu (tem), Kelembaban (hum), Tekanan Barometrik (b_pr).
$variables_from_module;
if(isset($_GET['wd']) &&isset($_GET['a_ws']) &&isset($_GET['m_ws'] ) &&isset($_GET['1_rf']) &&isset($_GET['24_rf']) &&isset($_GET['tem']) &&isset($_GET['hum']) &&isset($_GET ['b_pr'])){
 $variables_from_module =[
 "wd" => (int)$_GET['wd'],
 "a_ws" => (float)$_GET ['a_ws'],
 "m_ws" => (mengambang)$_GET['m_ws'],
 "1_rf" => (mengambang)$_GET['1_rf'],
 "24_rf" => (mengambang)$_GET['24_rf'],
 "tem" => (mengambang)$_GET['tem'],
 "hum" => (int)$_GET ['hum'],
 "b_pr" => (float)$_GET['b_pr']
 ];
}else{
 $variables_from_module =[
 "wd" => "err",
 "a_ws" => "err",
 "m_ws" => "err",
 "1_rf" => "err",
 "24_rf" => "err",
 "tem" => "err",
 "hum" => "err",
 "b_pr" => "err"
 ];
}
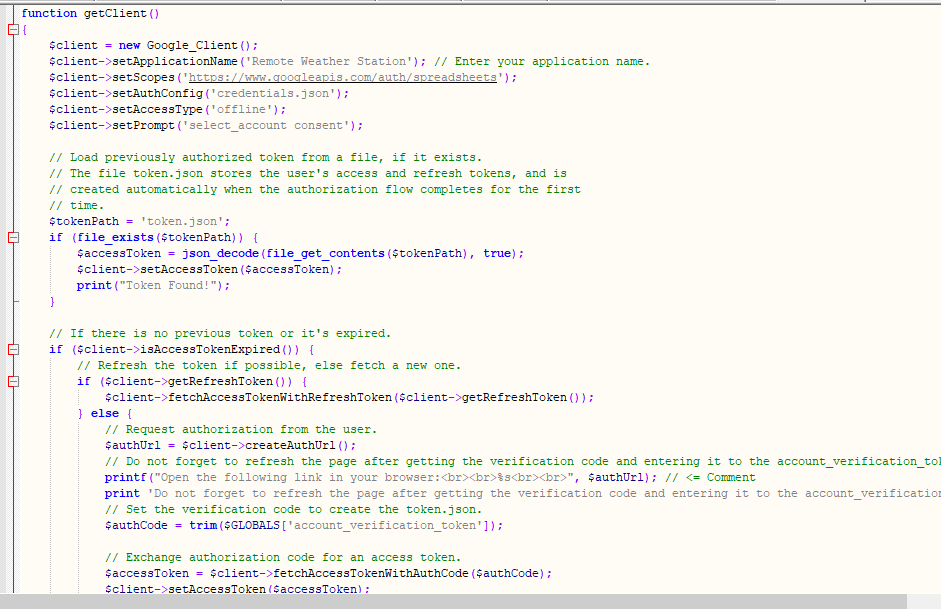
Hubungkan ke aplikasi Konsol Pengembang Google bernama Stasiun Cuaca Jarak Jauh dengan menggunakan credentials.json file (Langkah 2.1) .
$client =new Google_Client();
 $client->setApplicationName('Stasiun Cuaca Jarak Jauh'); // Masukkan nama aplikasi Anda.
 $client->setScopes('https://www.googleapis.com/auth/spreadsheets');
 $client->setAuthConfig('credentials.json');
 $client->setAccessType('offline');
 $client->setPrompt('select_account consent');
Muat token yang diotorisasi sebelumnya dari file (token.json ), jika ada.
$tokenPath ='token.json';
 if (file_exists($tokenPath)) {
 $accessToken =json_decode(file_get_contents($tokenPath), true);
 $client->setAccessToken($accessToken);
 print("Token Ditemukan!");
 }
Jika tidak ada token sebelumnya atau kedaluwarsa, minta otorisasi dari pengguna dan atur kode verifikasi untuk membuat token.json file dengan file_put_contents() fungsi.
if ($client->isAccessTokenExpired()) {
 // Segarkan token jika memungkinkan, jika tidak ambil yang baru.
 if ($client->getRefreshToken()) {
 $client->fetchAccessTokenWithRefreshToken($client->getRefreshToken());
 } else {
 // Meminta otorisasi dari pengguna.
 $authUrl =$client->createAuthUrl ();

 ...

 // Atur kode verifikasi untuk membuat token.json.
 $authCode =trim($GLOBALS['account_verification_token' ]);

 ...

 // Periksa apakah ada kesalahan dan akun_verifikasi_token dimasukkan.
 if (array_key_exists('error', $accessToken)) {
 throw new Exception(join(', ', $accessToken));
 }else{
 print("Berhasil! Refresh halaman.");
 }
 }
 // Menyimpan token ke file.
 if (!file_exists(dirname($tokenPath))) {
 mkdir(dirname($tokenPath), 0700 , true);
 }
 file_put_contents($tokenPath, json_encode($client->getAccessToken()));
 }
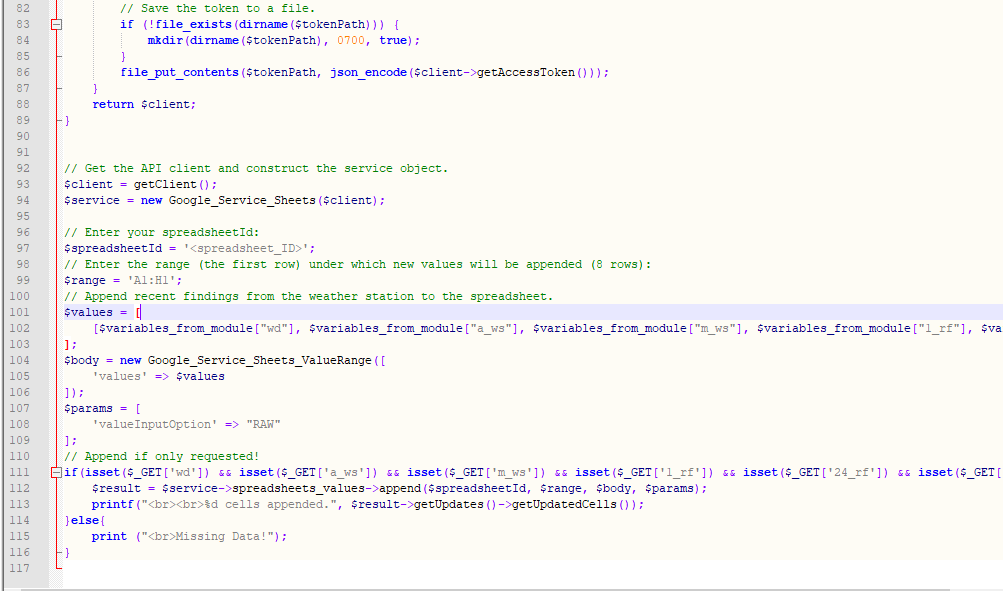
Masukkan ID spreadsheet dan rentang untuk menambahkan temuan terbaru dari stasiun cuaca ke spreadsheet.
https://docs.google.com/spreadsheets/d/spreadsheetId/edit#gid=0
// Masukkan spreadsheetId Anda:
$spreadsheetId ='';
// Masukkan rentang (baris pertama) di mana nilai baru akan ditambahkan (8 baris) :
$range ='A1:H1';
// Tambahkan temuan terbaru dari stasiun cuaca ke spreadsheet.
$values =[
[$variables_from_module["wd" ], $variables_from_module["a_ws"], $variables_from_module["m_ws"], $variables_from_module["1_rf"], $variables_from_module["24_rf"], $variables_from_module["tem"], $variables_from_module["24_rf"], $variables_from_module["tem"], $variables_from"_module $variables_from_module["b_pr"]]
];
$body =new Google_Service_Sheets_ValueRange([
'values' => $values
]);
$params =[
'valueInputOption' => "RAW"
];
...
$result =$service->spreadsheets_values->append( $spreadsheetId, $range, $body, $params);
printf("
%d sel ditambahkan.", $result->getUpdates()->getUpdatedCells());
akun_verifikasi_token.php
Setelah mengotorisasi aplikasi web dengan AuthUrl created yang dibuat , masukkan kode verifikasi yang diberikan untuk menyetel token akses.
$account_verification_token =""; // Masukkan kode verifikasi setelah otorisasi.
Langkah 3.1:Menyiapkan aplikasi web di Raspberry Pi (atau server apa pun)
Setelah membuat aplikasi web PHP, saya memutuskan untuk menjalankannya di Raspberry Pi saya, tetapi Anda dapat menjalankan aplikasi di server mana pun asalkan itu adalah server PHP.
Jika Anda ingin menggunakan Raspberry Pi tetapi tidak tahu cara menyiapkan server web LAMP di Raspberry Pi, Anda dapat memeriksa tutorial ini.
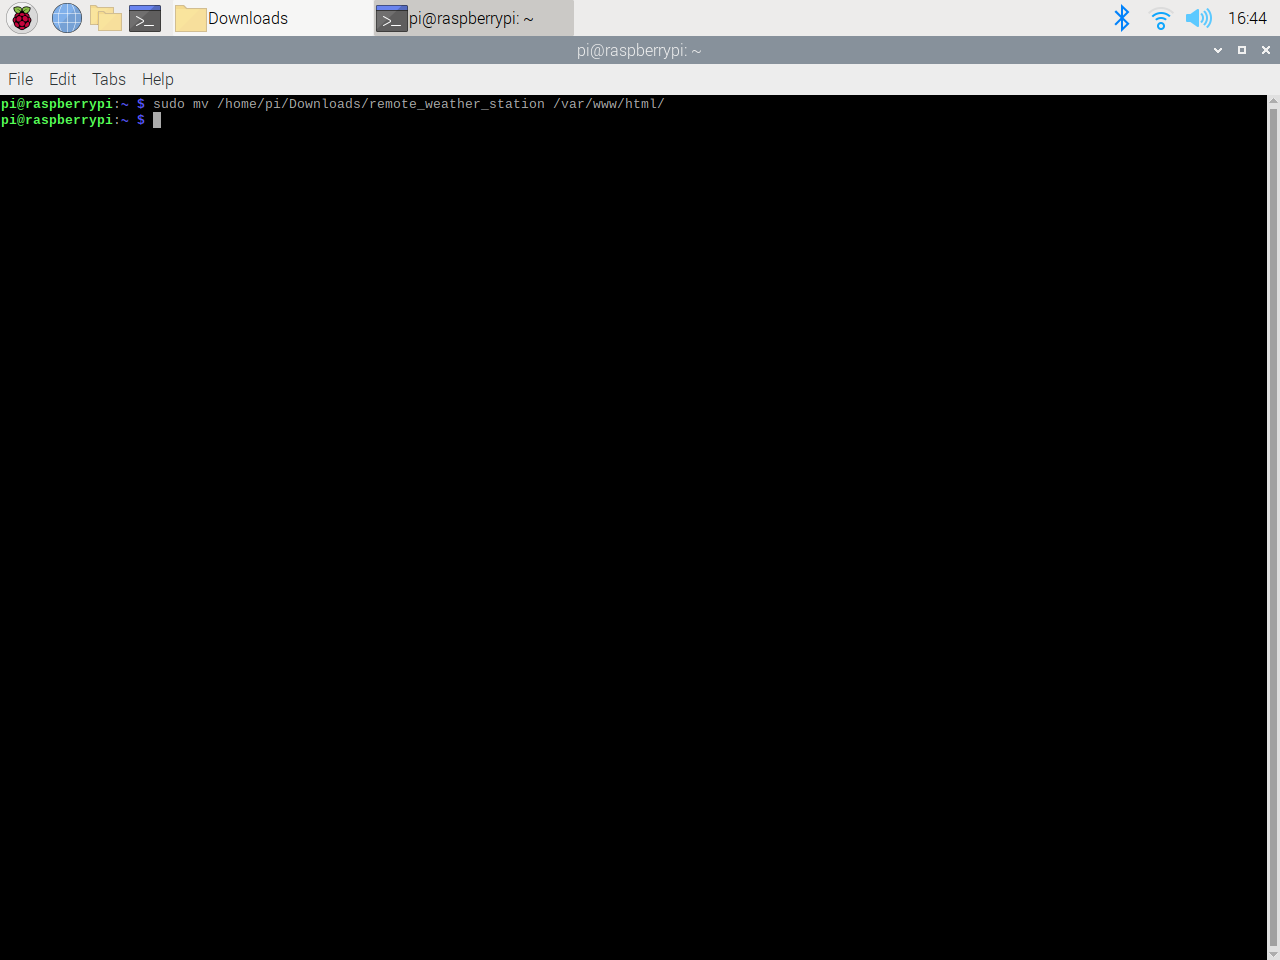
Pertama-tama, pindahkan folder aplikasi (remote_weather_station) ke server apache (/var/www/html) dengan menggunakan terminal karena server apache adalah lokasi yang dilindungi.
sudo mv /home/pi/Downloads/remote_weather_station /var/www/html/
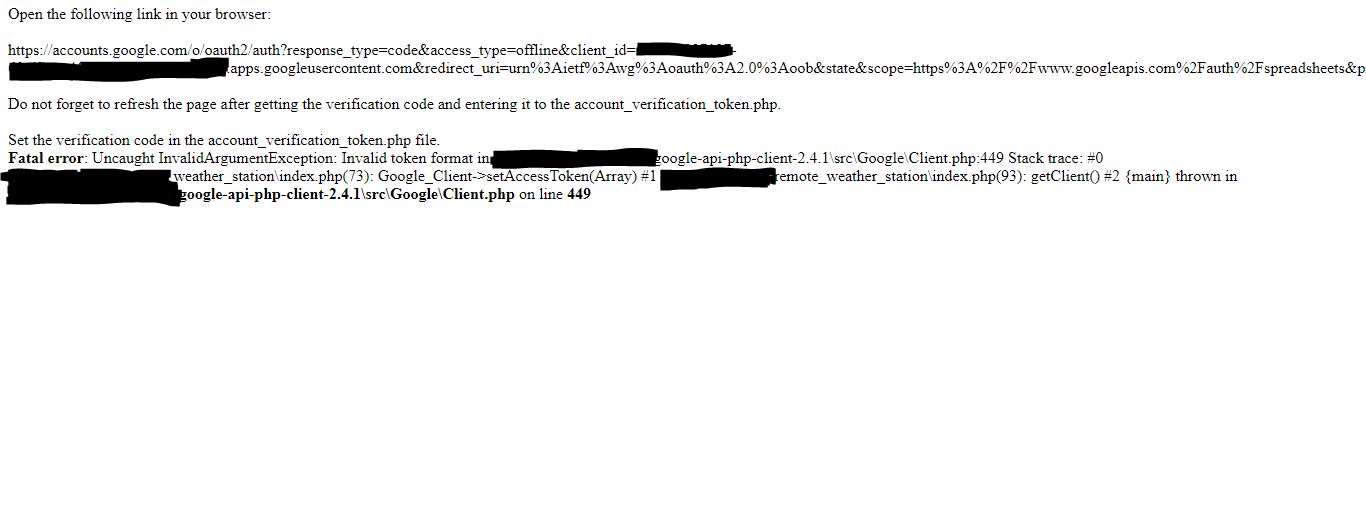
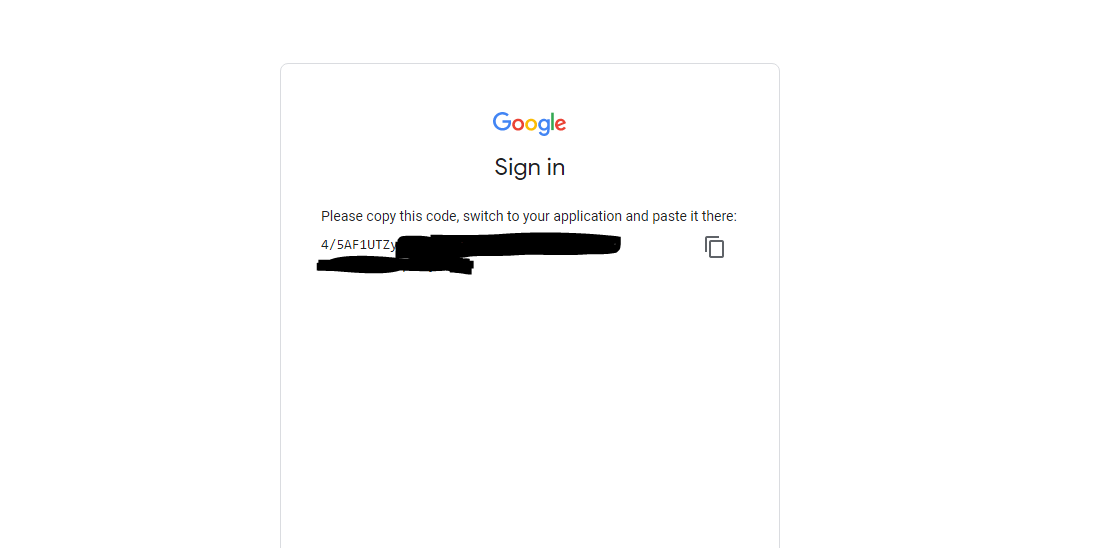
Aplikasi web membuat kesalahan saat pertama kali dibuka karena kode verifikasi yang hilang. Untuk mendapatkan kode verifikasi, buka tautan otorisasi yang dibuat oleh aplikasi.
Kemudian, klik untuk Pergi ke Stasiun Cuaca Jarak Jauh (tidak aman) .
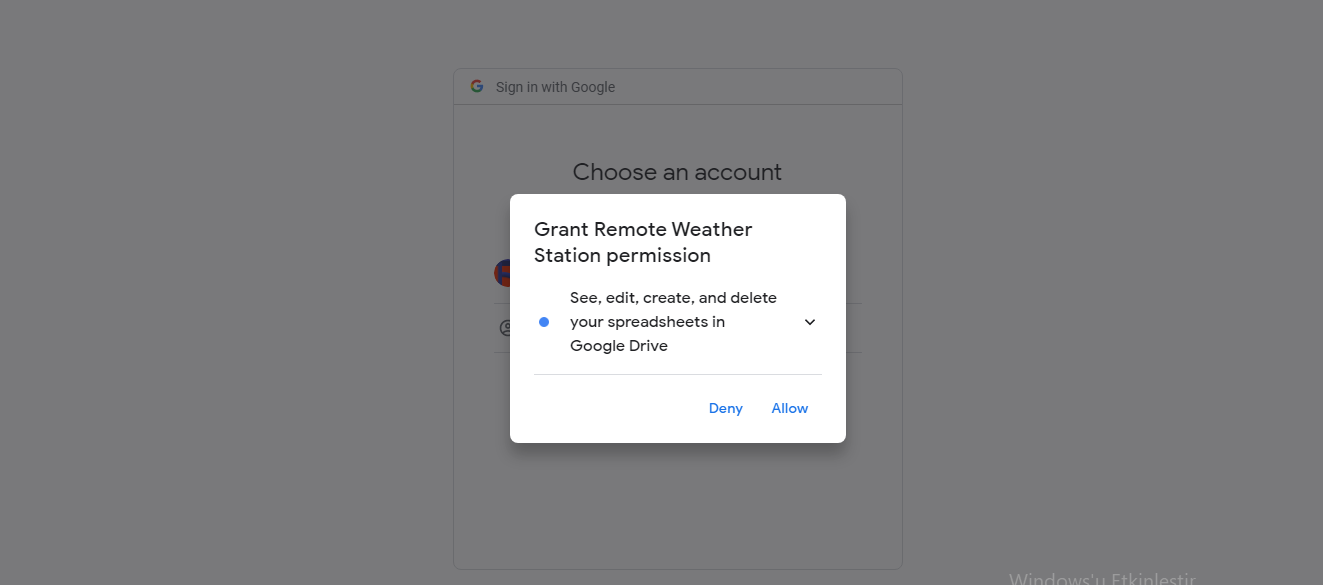
Berikan aplikasi dengan izin yang diperlukan.
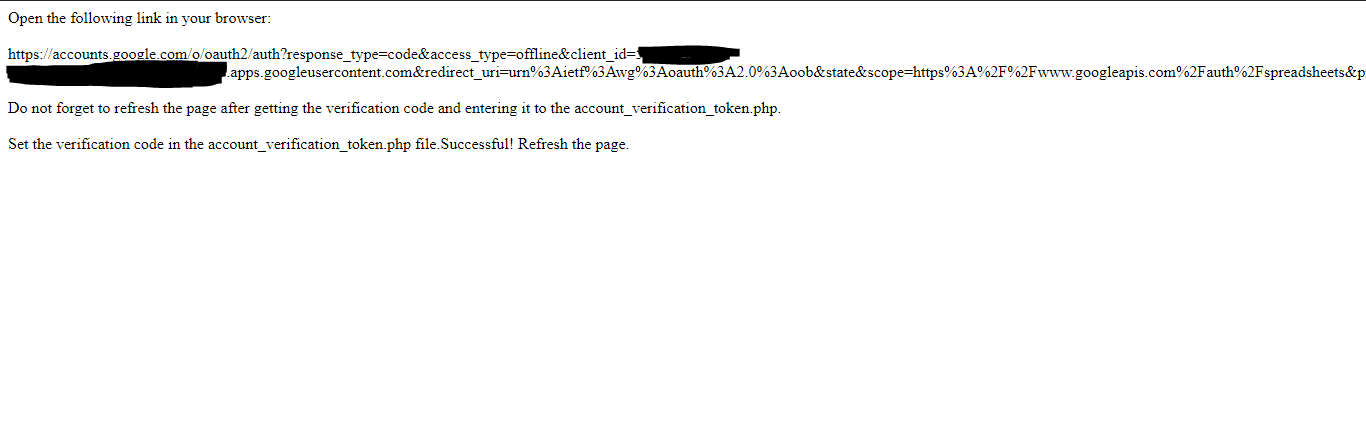
Sekarang, salin kode verifikasi dan tempel ke account_verification_token.php .
Kembali ke aplikasi web. Seharusnya menampilkan pesan konfirmasi:Berhasil! Segarkan halaman .
Setelah menyegarkan halaman, aplikasi web menggunakan kode verifikasi untuk mendapatkan token akses dan menyimpan token akses dalam file bernama token.json . Sehingga tidak menimbulkan error lagi.

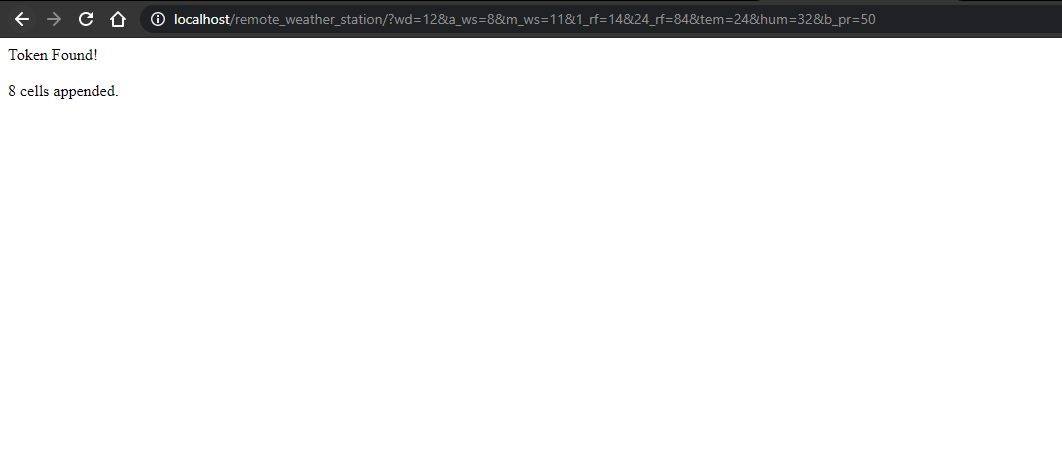
Untuk menguji apakah aplikasi web PHP menambahkan data baru ke spreadsheet yang diberikan secara akurat:
http://localhost/remote_weather_station/?wd=12&a_ws=8&m_ws=11&1_rf=14&24_rf=84&tem=24&hum=32&b_pr=57
Langkah 4:Membaca dan mengirim data cuaca dengan ESP8266 (WiFi)
Untuk mengumpulkan data cuaca di balkon saya, saya menggunakan papan pengembangan NodeMCU ESP-12E (ESP8266) dengan stasiun cuaca.
Saya memprogramnya untuk mengirim data cuaca ke aplikasi web PHP setiap lima menit.

Sertakan perpustakaan yang diperlukan dan tentukan pengaturan WiFi.
#include
#include
#include
#include
 #include

// Tentukan pengaturan WiFi Anda.
const char *ssid ="";
const char *password =" ";
Tentukan pengaturan stasiun cuaca dan pin koneksi serial - D6, D5.
// Tentukan pengaturan stasiun cuaca:
char databuffer[35];
double temp;
int transfer =0;

// Tentukan pin koneksi serial - RX dan TX.
SoftwareSerial Serial_1(D6, D5); // (Rx, Tx)
Dalam getBuffer() fungsi, dapatkan data dari stasiun cuaca.
void getBuffer(){
 int index;
 for (index =0;index <35;index ++){
 if(Serial_1.available()){
 databuffer[index] =Serial_1.read();
 if (databuffer[0] !='c'){
 index =-1;
 }
 }
 else{
 indeks --;
 }
 }
}
Debug data cuaca dan buat tautannya.
String weather_data ="wd=" + String(WindDirection()) + "&a_ws=" + String(WindSpeedAverage()) + "&m_ws=" + String(WindSpeedMax()) + "&1_rf=" + String(RainfallOneHour()) + "&24_rf=" + String(RainfallOneDay()) + "&tem=" + String(Suhu()) + "&hum=" + String(Humidity()) + "&b_pr=" + String( BarPressure());
Server string ="http://192.168.1.24/remote_weather_station/?";

...

int WindDirection(){ kembali transCharToInt(databuffer,1,3); } // Arah Angin (derajat)

mengambang Kecepatan Angin Rata-rata(){ temp =0.44704 * transCharToInt(databuffer,5,7); suhu kembali; } // Kecepatan Udara Rata-rata (1 menit)

mengambang WindSpeedMax(){ temp =0.44704 * transCharToInt(databuffer,9,11); suhu kembali; } //Kecepatan Udara Maks (5 menit)

Suhu mengambang(){ temp =(transCharToInt(databuffer,13,15) - 32.00) * 5.00 / 9.00; suhu kembali; } // Suhu ("C")

mengambang Curah HujanSatuJam(){ temp =transCharToInt(databuffer,17,19) * 25,40 * 0,01; suhu kembali; } // Curah hujan (1 jam)

mengambang Curah HujanSatuHari(){ temp =transCharToInt(databuffer,21,23) * 25,40 * 0,01; suhu kembali; } // Curah hujan (24 jam)

int Kelembaban(){ return transCharToInt(databuffer,25,26); } // Kelembaban (%)

float BarPressure(){ temp =transCharToInt(databuffer,28,32); suhu kembali / 10.00; } // Barometric Pressure (hPA)
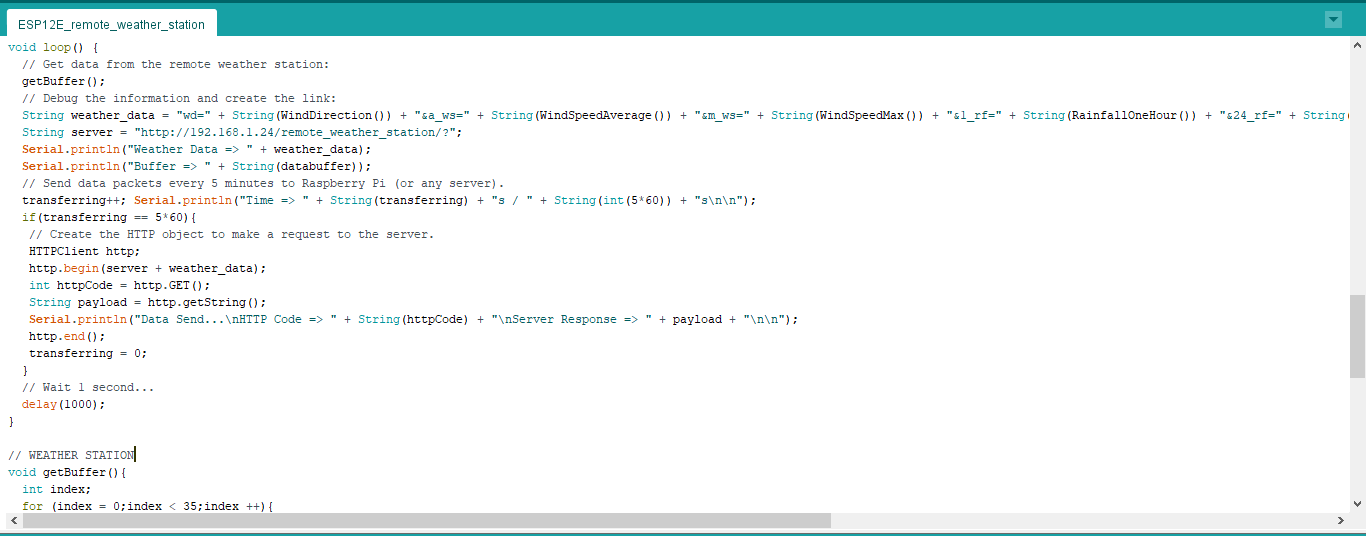
⭐ Send data packets every 5 minutes to Raspberry Pi (or any server).
transferring++; Serial.println("Time => " + String(transferring) + "s / " + String(int(5*60)) + "s\n\n");
 if(transferring ==5*60){
 // Create the HTTP object to make a request to the server.
 HTTPClient http;
 http.begin(server + weather_data);
 int httpCode =http.GET();
 String payload =http.getString();
 Serial.println("Data Send...\nHTTP Code => " + String(httpCode) + "\nServer Response => " + payload + "\n\n");
 http.end();
 transferring =0;
 }
 // Wait 1 second...
 delay(1000);
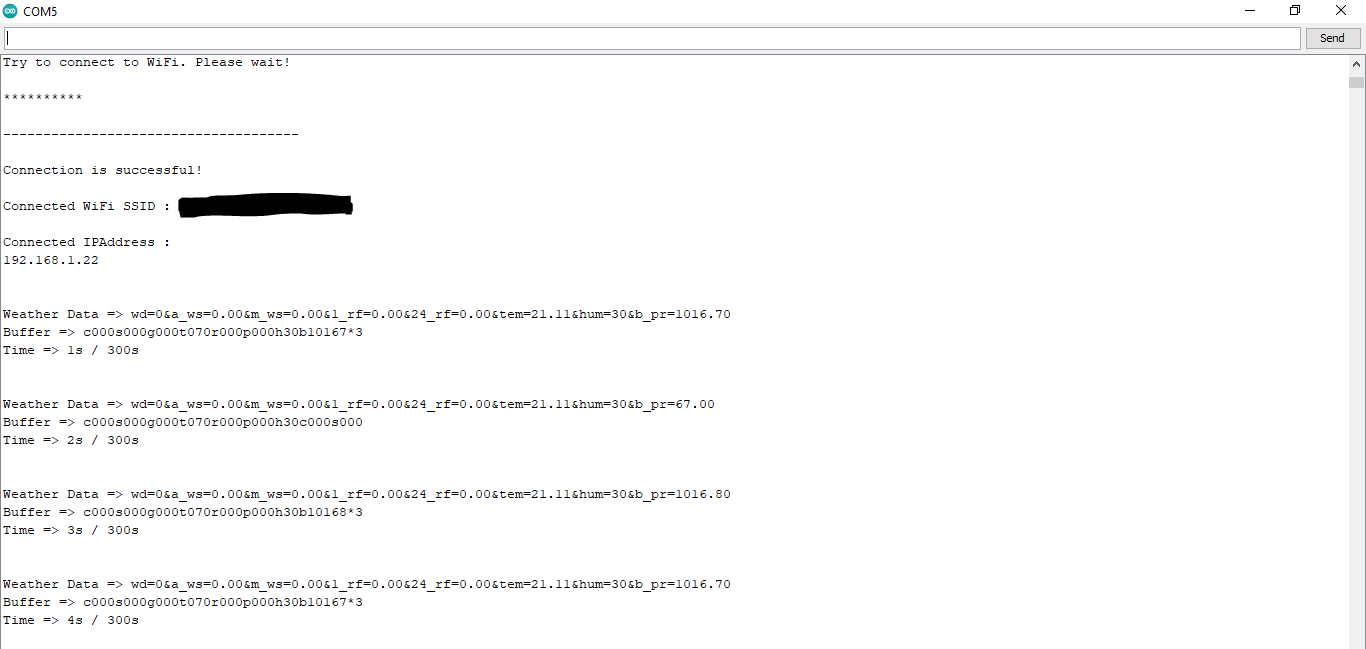
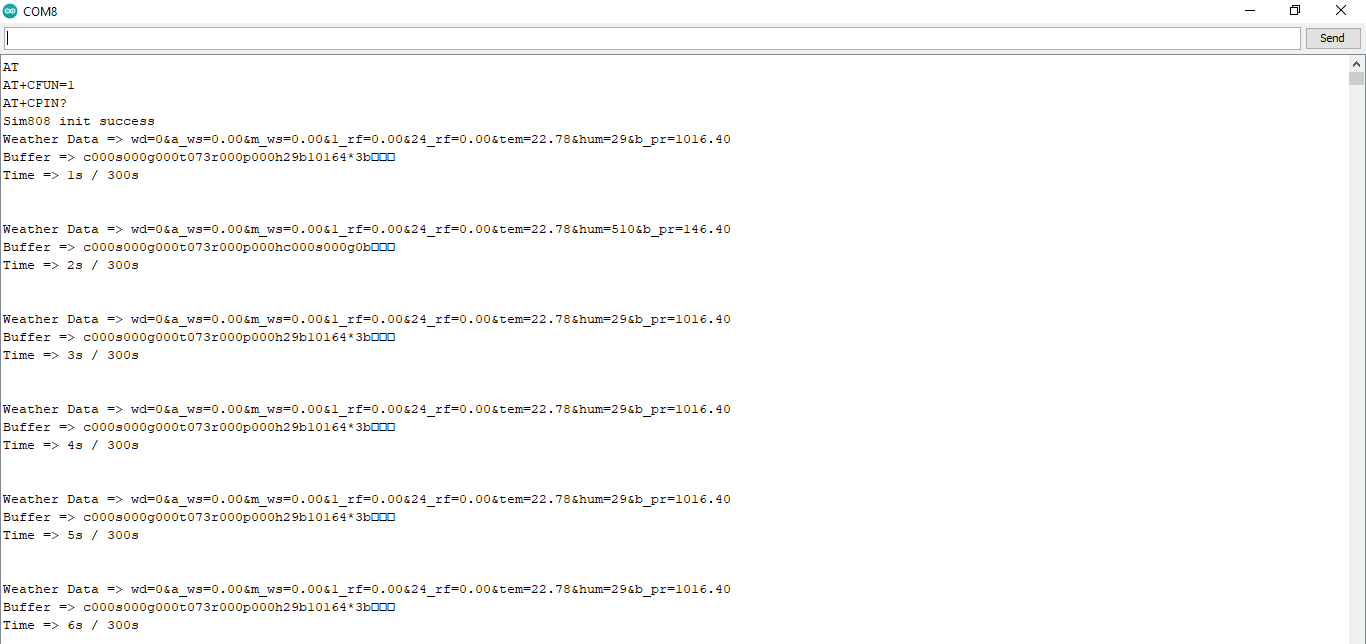
⭐ After uploading the code to the NodeMCU ESP-12E (ESP8266) development board, it displays weather data every second on the serial monitor and sends data packets every five minutes (300 seconds) to the PHP web application.
Connection is successful!

...

Weather Data => wd=0&a_ws=0.00&m_ws=0.00&1_rf=0.00&24_rf=0.00&tem=21.67&hum=29&b_pr=1016.70
Buffer => c000s000g000t071r000p000h29b10167*3
Time => 299s / 300s


Weather Data => wd=0&a_ws=0.00&m_ws=0.00&1_rf=0.00&24_rf=0.00&tem=21.67&hum=29&b_pr=1016.70
Buffer => c000s000g000t071r000p000h29b10167*3
Time => 300s / 300s

...
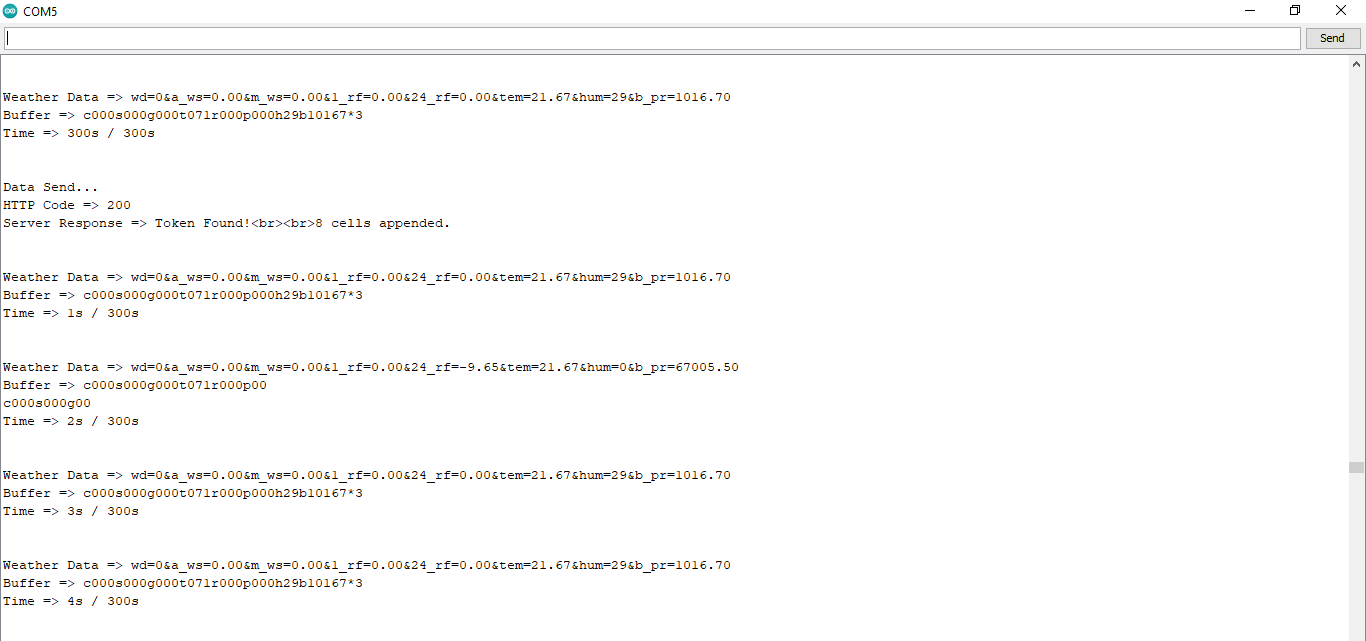
⭐ Then, it shows the response from the server.
...

Data Send...
HTTP Code => 200
Server Response => Token Found!

8 cells appended.

...
Step 4.1:Reading and sending weather data with SIM808 (GPRS)
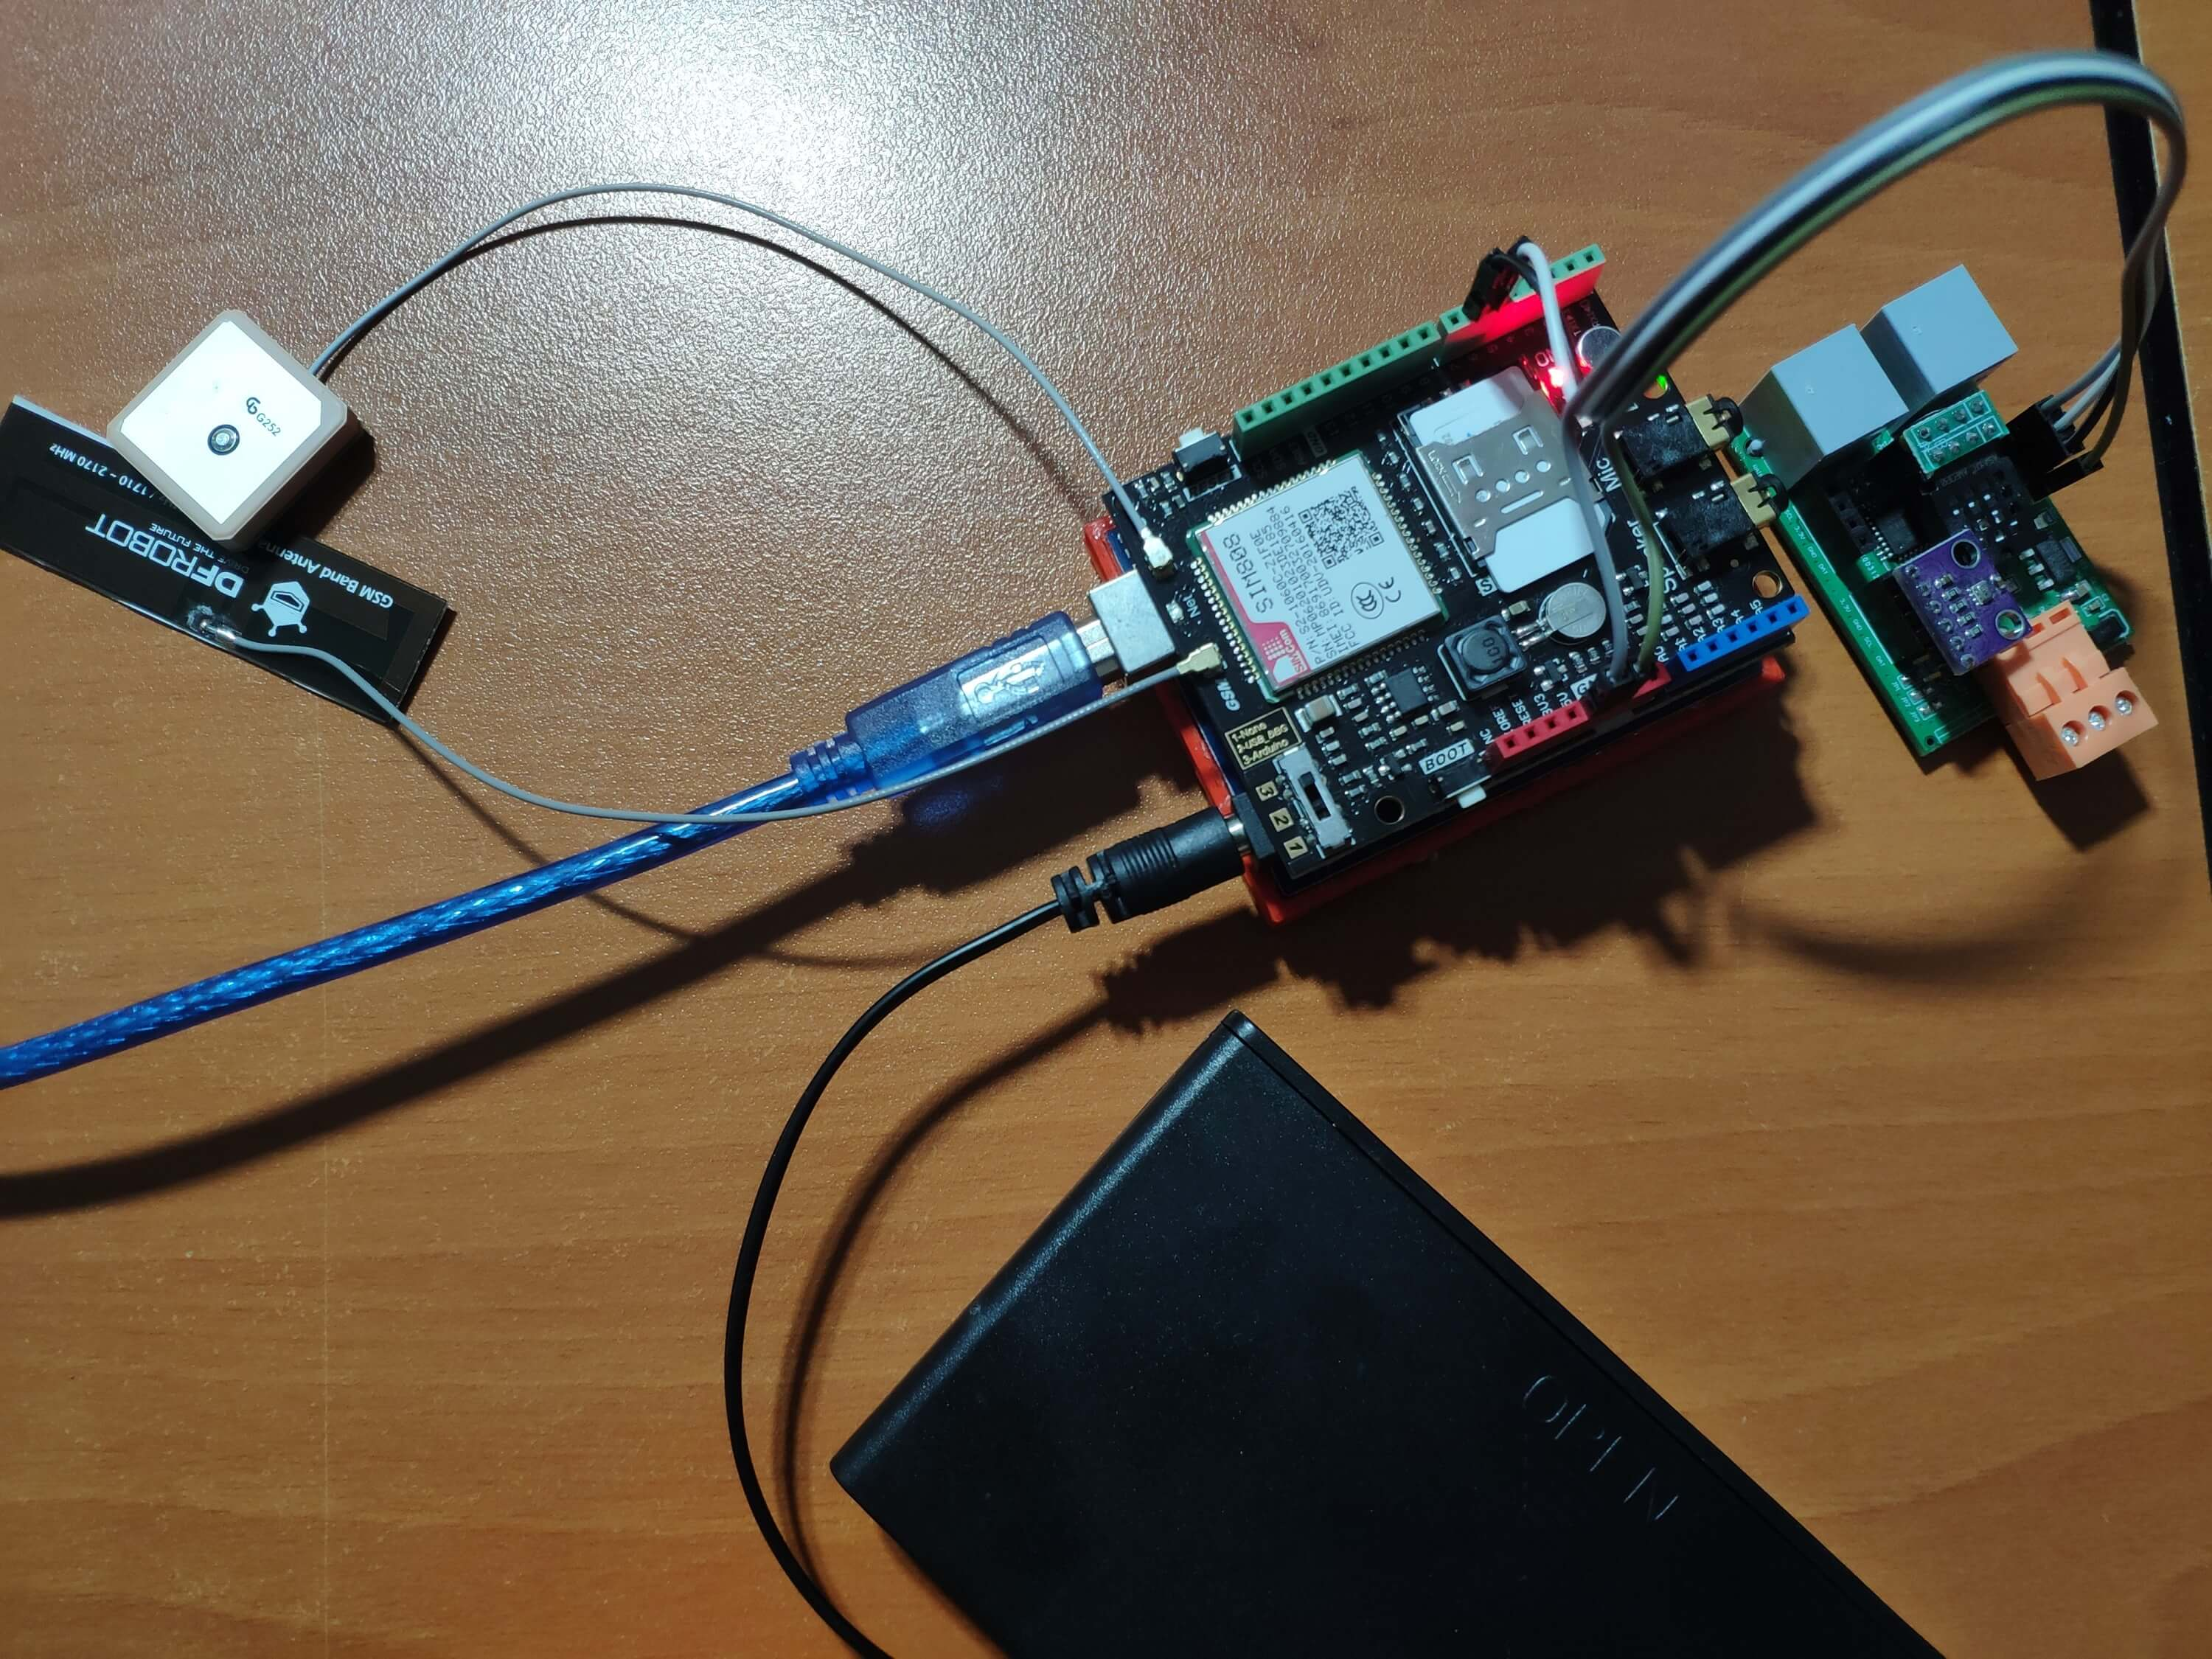
To collect weather data in my backyard, I used a SIM808 shield for Arduino Uno if the distance between the weather station and my router is too far away.
Most of the code is the same and covered in the previous step aside from the parts below.
⭐ Include required libraries and define the sim808 object.
For SIM808 GPS/GPRS/GSM Shield | Download
#include
#include

// Define the sim808.
DFRobot_SIM808 sim808(&Serial);
⭐ Initialize the SIM808 module and continue if it is working accurately.
//******** Initialize sim808 module *************
 while(!sim808.init()) {
 delay(1000);
 Serial.print("Sim808 init error\r\n");
 }
 delay(2000);
 // Continue if the SIM808 Module is working accurately.
 Serial.println("Sim808 init success");
 delay(5000);
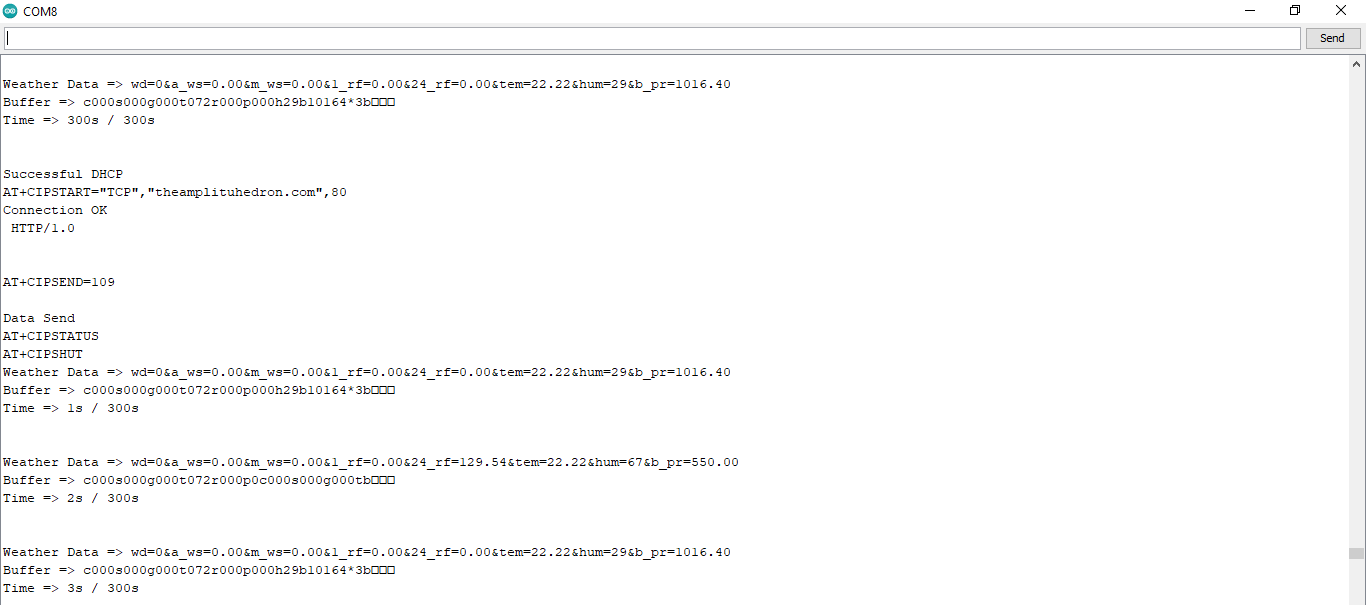
⭐ Send data packets every 5 minutes to the server by establishing a TCP connection to make a GET request.
transferring++; Serial.println("Time => " + String(transferring) + "s / " + String(int(5*60)) + "s\n\n");
 if(transferring ==5*60){
 //*********** Attempt DHCP *******************
 while(!sim808.join(F("cmnet"))) {
 Serial.println("Sim808 join network error!");
 delay(2000);
 }
 //************ Successful DHCP ****************
 delay(5000);
 Serial.println("Successful DHCP");
 //*********** Establish a TCP connection ************
 if(!sim808.connect(TCP,"192.168.1.24", 80)) { // Change it with your server.
 Serial.println("Connection Error");
 }else{
 Serial.println("Connection OK");
 }
 delay(2000);

 ...
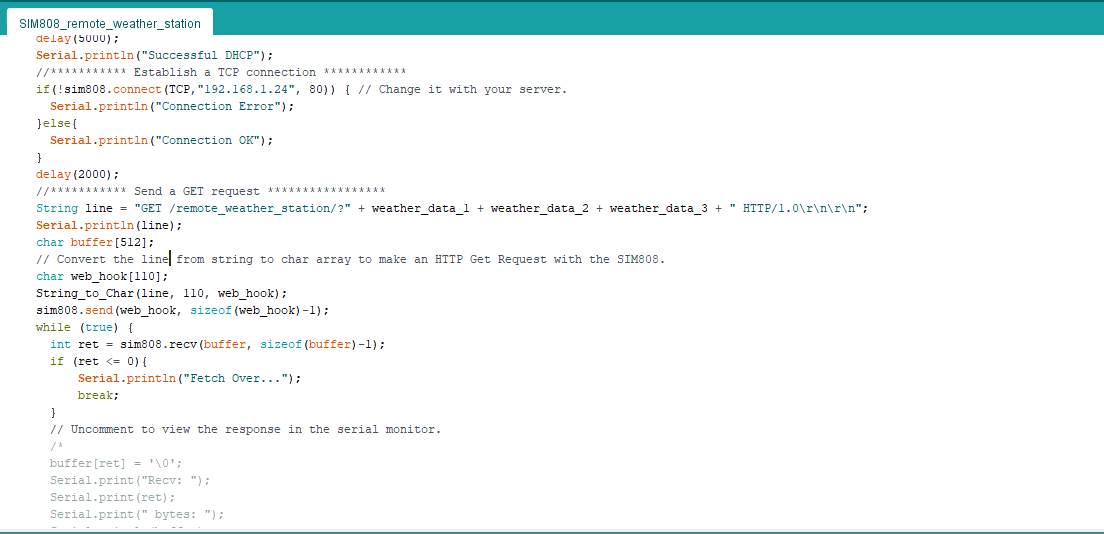
⭐ After creating the line string, convert it from string to char array to make an HTTP Get Request with the SIM808.
...

 String line ="GET /remote_weather_station/?" + weather_data_1 + weather_data_2 + weather_data_3 + " HTTP/1.0\r\n\r\n";
 Serial.println(line);
 char buffer[512];
 // Convert the line from string to char array to make an HTTP Get Request with the SIM808.
 char web_hook[110];
 String_to_Char(line, 110, web_hook);
 sim808.send(web_hook, sizeof(web_hook)-1);
 while (true) {
 int ret =sim808.recv(buffer, sizeof(buffer)-1);
 if (ret <=0){
 Serial.println("Fetch Over...");
 break;
 }

 ...
⭐ After uploading the code to the SIM808 shield, it displays weather data every second on the serial monitor and sends data packets every five minutes (300 seconds) to the PHP web application.
Step 4.2:Creating the weather data set for more than three months
After finishing coding, I started to collate weather data on Google Sheets every five minutes for more than three months to build a neural network model and make predictions on the rainfall intensity.
Collected Weather Data:
- Wind Direction (deg)
- Average Wind Speed (m/s)
- Max Wind Speed (m/s)
- One-Hour Rainfall (mm)
- 24-Hours Rainfall (mm)
- Temperature (°C)
- Humidity (%)
- Barometric Pressure (hPa)
Then, I downloaded the spreadsheet as Remote Weather Station.csv , consisting of 32219 rows as my preliminary local weather data set. I am still collating weather data to improve my data set and model :)
Step 5:Building an Artificial Neural Network (ANN) with TensorFlow
When I completed collating my preliminary local weather data set, I started to work on my artificial neural network (ANN) model to make predictions on the rainfall intensity.
I decided to create my neural network model with TensorFlow in Python. So, first of all, I followed the steps below to grasp a better understanding of the weather data:
- Data Visualization
- Data Scaling (Normalizing)
- Data Preprocessing
- Data Splitting
After applying these steps, I decided to use my neural network model to classify different rainfall intensity classes theoretically assigned as labels (outputs) for each input (row). I created my classes according to the rate of precipitation, which depends on the considered time.
The following categories are used to classify rainfall intensity by the rate of precipitation (rainfall):
- Light rain — when the precipitation rate is <2.5 mm per hour
- Moderate rain — when the precipitation rate is between 2.5 mm and 7.6 mm per hour
- Heavy rain — when the precipitation rate is between 7.6 mm and 50 mm per hour
- Violent rain — when the precipitation rate is> 50 mm per hour
According to the precipitation (rainfall) rates, I preprocessed the weather data to assign one of these five classes for each input as its label:
- 0 (None)
- 1 (Light Rain)
- 2 (Moderate Rain)
- 3 (Heavy Rain)
- 4 (Violent Rain)
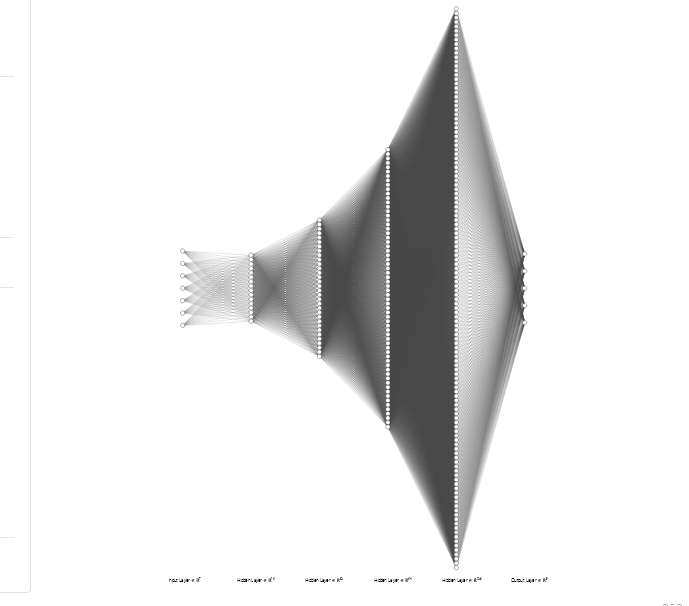
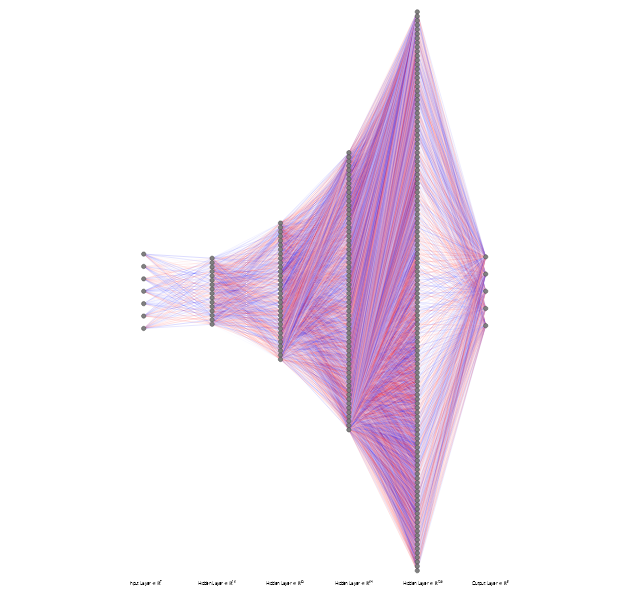
After scaling (normalizing) and preprocessing the weather data, I elicited seven input variables and one label for each reading, classified with the five mentioned classes. Then, I built an artificial neural network model with TensorFlow to obtain the best possible results and predictions with my preliminary data set.
Layers:
- 7 [Input]
- 16 [Hidden]
- 32 [Hidden]
- 64 [Hidden]
- 128 [Hidden]
- 5 [Output]
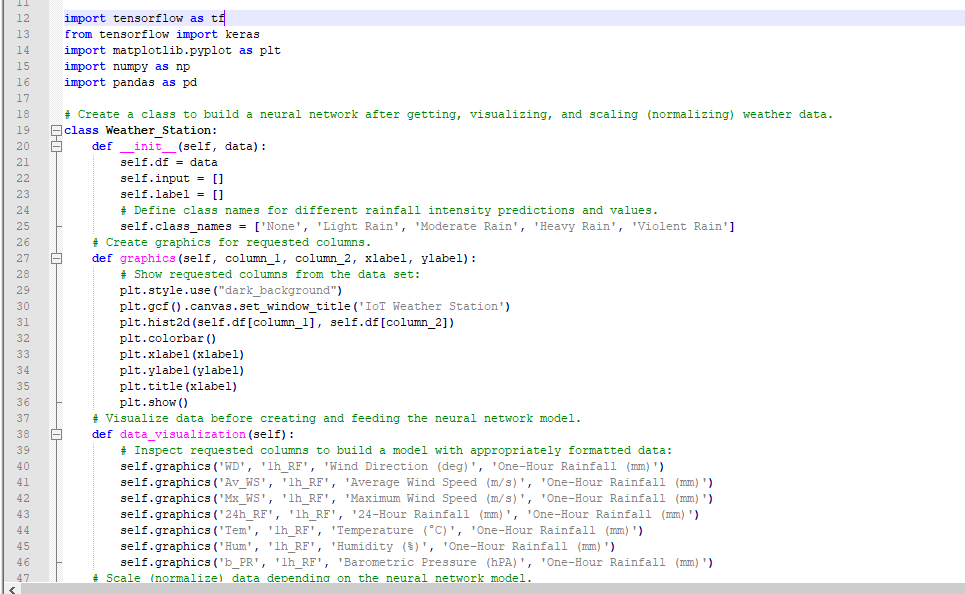
To execute all steps above, I created a class named Weather_Station in Python after including the required libraries:
import tensorflow as tf
from tensorflow import keras
import matplotlib.pyplot as plt
import numpy as np
import pandas as pd
Subsequently, I will discuss coding in Python for each step I mentioned above.
Also, you can download IoT_weather_station_neural_network.py to inspect coding.
Step 5.1:Visualizing and scaling (normalizing) the weather data
Before diving in to build a model, it is important to understand the weather data to pass the model appropriately formatted data.
So, in this step, I will show you how to visualize weather data and scale (normalize) in Python.
⭐ First of all, read the weather data from Remote Weather Station.csv .
csv_path ="E:\PYTHON\Remote Weather Station.csv"
df =pd.read_csv(csv_path)
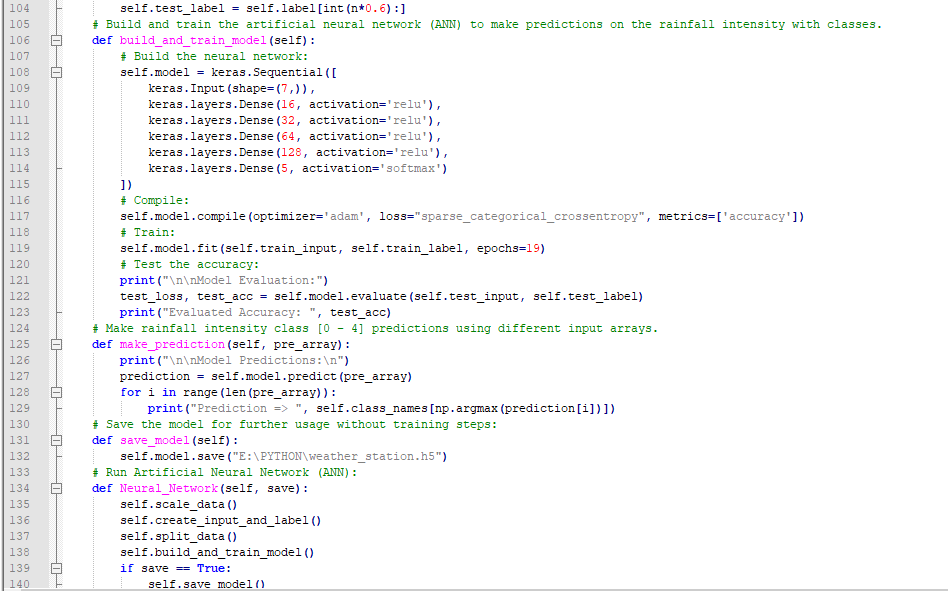
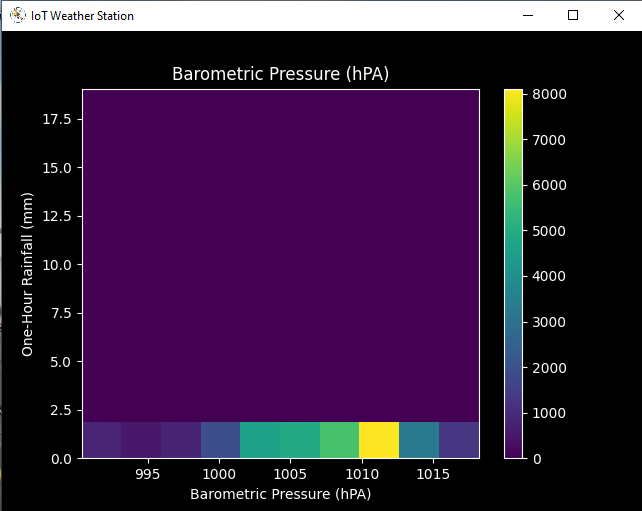
⭐ In the graphics() function, visualize the requested columns from the weather data set by using the Matplotlib library.
def graphics(self, column_1, column_2, xlabel, ylabel):
 # Show requested columns from the data set:
 plt.style.use("dark_background")
 plt.gcf().canvas.set_window_title('IoT Weather Station')
 plt.hist2d(self.df[column_1], self.df[column_2])
 plt.colorbar()
 plt.xlabel(xlabel)
 plt.ylabel(ylabel)
 plt.title(xlabel)
 plt.show()
⭐ In the data_visualization() function, inspect all columns before scaling weather data to build a model with appropriately formatted data.
def data_visualization(self):
# Inspect requested columns to build a model with appropriately formatted data:
self.graphics('WD', '1h_RF', 'Wind Direction (deg)', 'One-Hour Rainfall (mm)')
self.graphics('Av_WS', '1h_RF', 'Average Wind Speed (m/s)', 'One-Hour Rainfall (mm)')
self.graphics('Mx_WS', '1h_RF', 'Maximum Wind Speed (m/s)', 'One-Hour Rainfall (mm)')
self.graphics('24h_RF', '1h_RF', '24-Hour Rainfall (mm)', 'One-Hour Rainfall (mm)')
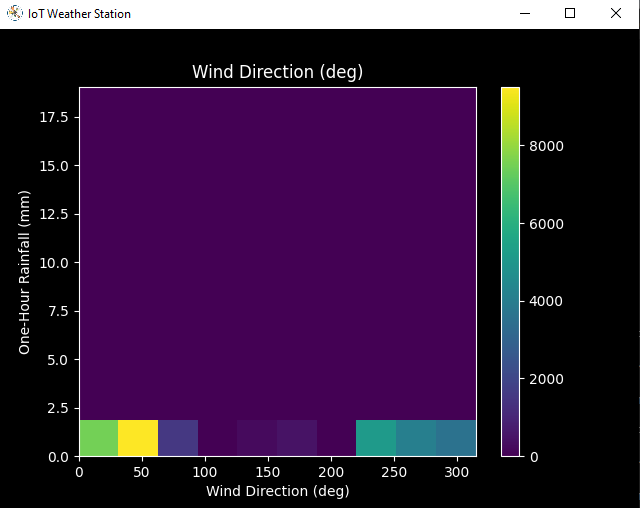
self.graphics('Tem', '1h_RF', 'Temperature (°C)', 'One-Hour Rainfall (mm)')
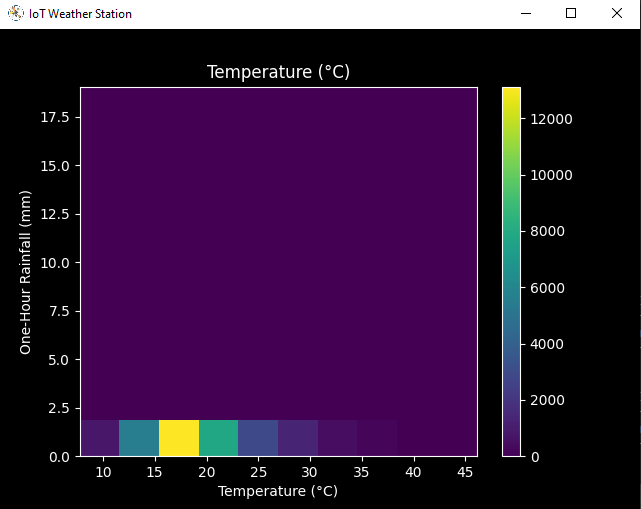
self.graphics('Hum', '1h_RF', 'Humidity (%)', 'One-Hour Rainfall (mm)')
self.graphics('b_PR', '1h_RF', 'Barometric Pressure (hPA)', 'One-Hour Rainfall (mm)')
After visualizing weather data, I scaled (normalized) each column to format it properly.
Normally, each row (reading) looked like this before scaling:
- 315, 0.45, 0, 0.51, 0.51, 22.78, 65, 1005.5
⭐ In the scale_data() function:
⭐ The wind direction in units of degrees and angles do not make good model inputs. 360° and 0° should be close to each other and wrap around smoothly. The direction should not matter if the wind is not blowing. Thus, convert the wind direction and velocity columns to a wind vector to interpret them easily with a neural network model.
def scale_data(self):
 # Wind Direction and Speed:
 wv =self.df.pop('Av_WS')
 max_wv =self.df.pop('Mx_WS')
 # Convert to radians.
 wd_rad =self.df.pop('WD')*np.pi / 180
 # Calculate the wind x and y components.
 self.df['scaled_WX'] =wv*np.cos(wd_rad)
 self.df['scaled_WY'] =wv*np.sin(wd_rad)
 # Calculate the max wind x and y components.
 self.df['scaled_max_WX'] =max_wv*np.cos(wd_rad)
 self.df['scaled_max_WY'] =max_wv*np.sin(wd_rad)

 ...
⭐ For the remaining columns except for 1h_RF , divide them into average reading values to scale (normalize) and format.
...

 # Temperature:
 tem =self.df.pop('Tem')
 self.df['scaled_Tem'] =tem / 25
 # Humidity:
 hum =self.df.pop('Hum')
 self.df['scaled_Hum'] =hum / 70
 # Barometric Pressure:
 bPR =self.df.pop('b_PR')
 self.df["scaled_bPR"] =bPR / 1013
 # 24 Hour Rainfall (Approx.)
 rain_24 =self.df.pop('24h_RF')
 self.df['scaled_24h_RF'] =rain_24 / 24
After completing scaling (normalizing), I extracted these new columns from the weather data set:
- scaled_WX
- scaled_WY
- scaled_max_WX
- scaled_max_WY
- scaled_Tem
- scaled_Hum
- scaled_bPR
- scaled_24h_RF
Step 5.2:Training the model (ANN) on the rainfall intensity classes
Before building and training a neural network model in TensorFlow, I needed to create the input array and the label array by preprocessing the scaled and normalized weather data set.
⭐ In the create_input_and_label() function:
⭐ Firstly, append each input element as a NumPy array to the input array and convert it to a NumPy array by using the asarray() function.
⭐ Each input element includes seven variables [shape=(7, )]:
- [scaled_WX, scaled_WY, scaled_max_WX, scaled_max_WY, scaled_Tem, scaled_Hum, scaled_bPR]
def create_input_and_label(self):
 n =len(self.df)
 # Create the input array using the scaled variables:
 for i in range(n):
 self.input.append(np.array([self.df['scaled_WX'][i], self.df['scaled_WY'][i], self.df['scaled_max_WX'][i], self.df['scaled_max_WY'][i], self.df['scaled_Tem'][i], self.df['scaled_Hum'][i], self.df['scaled_bPR'][i]]))
 self.input =np.asarray(self.input)

 ...
⭐ Then, evaluate the approximate rainfall (precipitation) rate for each reading (row).
approx_RF_rate =(1h_RF + scaled_24h_RF) * 100
⭐ According to the rainfall rate, assign a class [0 - 4] for each input element and append them to the label array.
...

 for i in range(n):
 _class =0
 # Evaluate the approximate rainfall rate:
 approx_RF_rate =(self.df['1h_RF'][i] + self.df['scaled_24h_RF'][i]) * 100
 # As labels, assign classes of rainfall intensity according to the approximate rainfall rate (mm):
 if approx_RF_rate ==0:
 _class =0
 elif approx_RF_rate <2.5:
 _class =1
 elif 2.5  _class =2
 elif 7.6  _class =3
 else:
 _class =4
 self.label.append(_class)
 self.label =np.asarray(self.label)
After preprocessing the scaled weather data to create input and label arrays, I split them as training (60%) and test (40%) data sets:
def split_data(self):
 n =len(self.df)
 # (60%, 40%) - (training, test)
 self.train_input =self.input[0:int(n*0.6)]
 self.test_input =self.input[int(n*0.6):]
 self.train_label =self.label[0:int(n*0.6)]
 self.test_label =self.label[int(n*0.6):]
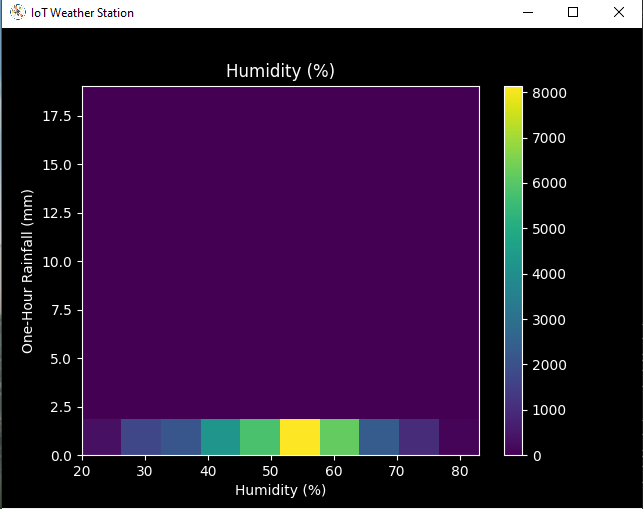
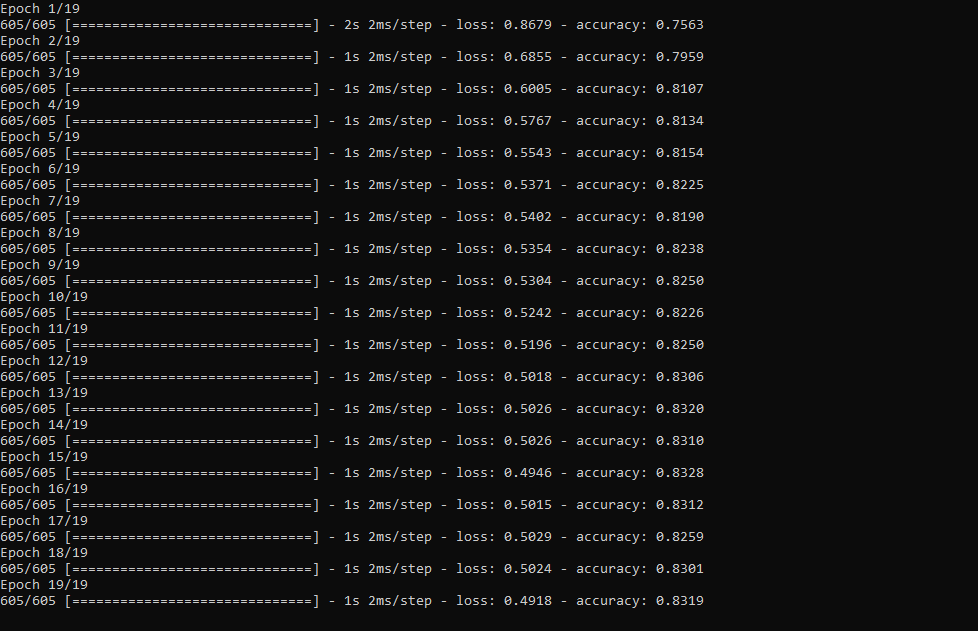
Then, I built my artificial neural network (ANN) model by using Keras and trained it with the training data set for nineteen epochs.
You can inspect these tutorials to learn about activation functions, loss functions, epochs, etc.
def build_and_train_model(self):
 # Build the neural network:
 self.model =keras.Sequential([
 keras.Input(shape=(7,)),
 keras.layers.Dense(16, activation='relu'),
 keras.layers.Dense(32, activation='relu'),
 keras.layers.Dense(64, activation='relu'),
 keras.layers.Dense(128, activation='relu'),
 keras.layers.Dense(5, activation='softmax')
 ])
 # Compile:
 self.model.compile(optimizer='adam', loss="sparse_categorical_crossentropy", metrics=['accuracy'])
 # Train:
 self.model.fit(self.train_input, self.train_label, epochs=19)

 ...
After training with the preliminary training data set, the accuracy of the model is between 0.83 and 0.85 .
Step 5.3:Evaluating the model and making predictions on the rainfall intensity
After building and training my artificial neural network model, I tested its accuracy by using the preliminary testing data set.
For now, the evaluated accuracy of the model is between 0.72 and 0.73 due to inadequate testing data set overfitting the model. However, I am still collecting weather data to improve the model accuracy.
...
# Test the accuracy:
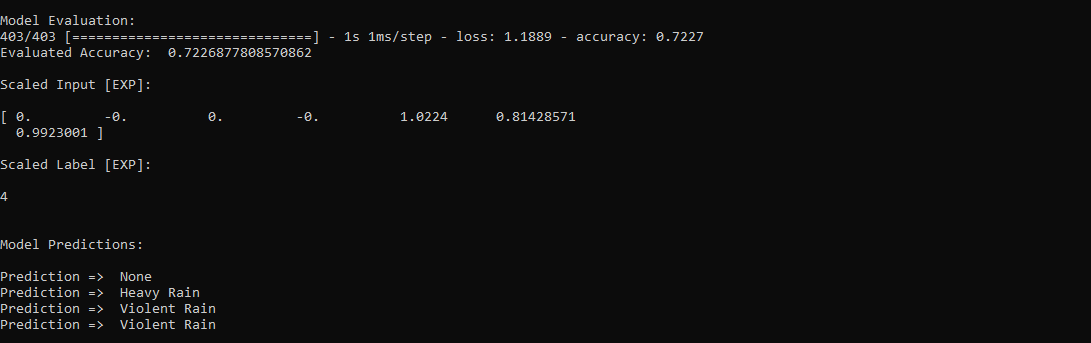
print("\n\nModel Evaluation:")
test_loss, test_acc =self.model.evaluate(self.test_input, self.test_label)
print("Evaluated Accuracy:", test_acc)
Then, I used my neural network model to make predictions on the rainfall intensity with a given prediction array consisting of readings from the weather station after the training of the model. As a starting point, the model works fine :)
The model predicts possibilities of labels for each input element as an array of 5 numbers. They represent the model's "confidence" that the given input element corresponds to each of the five different classes of rainfall intensity [0 - 4].
⭐ In the make_prediction() function, make a prediction for each input element in a given array and get the most accurate label [0 - 4] by using the argmax() function to display its class name.
def make_prediction(self, pre_array):
 print("\n\nModel Predictions:\n")
 prediction =self.model.predict(pre_array)
 for i in range(len(pre_array)):
 print("Prediction => ", self.class_names[np.argmax(prediction[i])])
Prediction Inputs:
- [0, 0, 0.31819805, 0.31819805, 0.6988, 0.81498571, 0.99349753]
- [0, -0, 0, -0, 0.8444, 1, 0.96835143]
- [0, 0, 0.45, 0, 0.87577, 0.95857143, 1.00128332]
- [-0, -0, -0, -0, 0.8224, 1.05714286, 0.99279368]
Prediction Outputs:
- 0 [None]
- 3 [Heavy Rain]
- 4 [Violent Rain]
- 4 [Violent Rain]

Connections and Adjustments (ESP8266) // Connections
// NodeMCU ESP-12E (ESP8266) :
// Weather Station
// VV --------------------------- 5V
// D5 --------------------------- RX
// D6 --------------------------- TX
// G --------------------------- GND
I connected the sensor (converter) board to the NodeMCU ESP-12E (ESP8266) development board and fastened them to a plastic box while collecting weather data at my balcony.
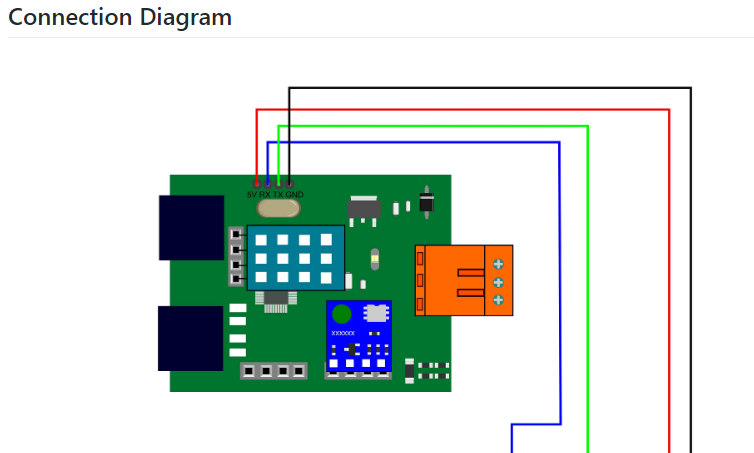
Connections and Adjustments (SIM808) // Connections
// Arduino Uno:
// SIM808 GPS/GPRS/GSM Shield For Arduino
// D0 --------------------------- RX
// D1 --------------------------- TX
// D12 --------------------------- POWER
// Weather Station
// 5V --------------------------- 5V
// D5 --------------------------- RX
// D6 --------------------------- TX
// GND --------------------------- GND
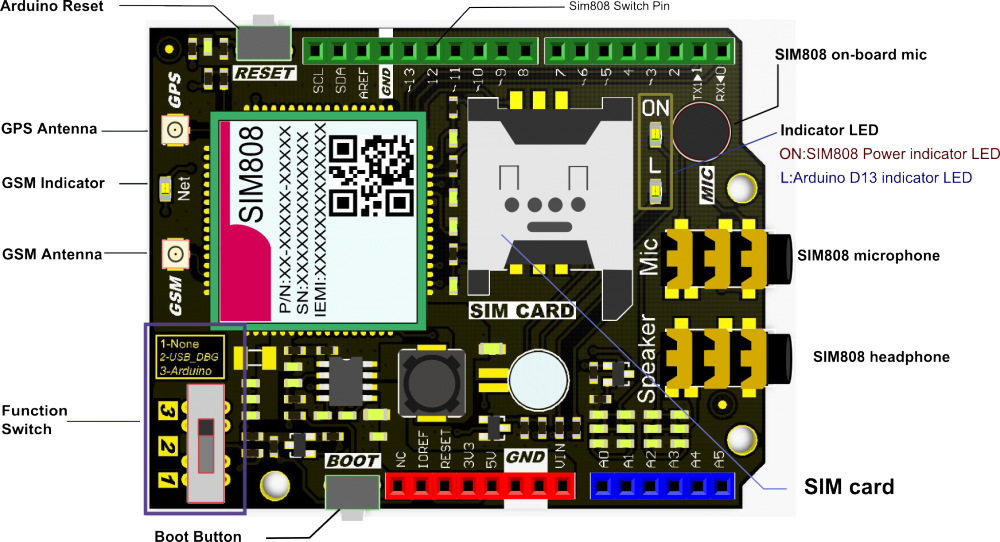
⭐ Note:D0, D1, D12 pins are occupied by the SIM808 GPS/GPRS/GSM Shield.
⭐ Connect an external battery (7-23V) for the SIM808 module to work properly.
⭐ Attach the GPS antenna and the GSM antenna to the SIM808 shield.
⭐ Insert a SIM card into the SIM slot on the SIM808 shield.
⭐ Before uploading the code, set the function switch on the shield to None (1).
⭐ Upload the code.
⭐ Then, set the function switch to Arduino (3).
⭐ Press the Boot button on the shield until seeing the Net indicator LED flashing every 1 second and wait for the SIM card to register the network - the Net indicator LED will slowly flash every 3 seconds.
⭐ Click here to get more information about the SIM808 GSM/GPS/GPRS Shield.
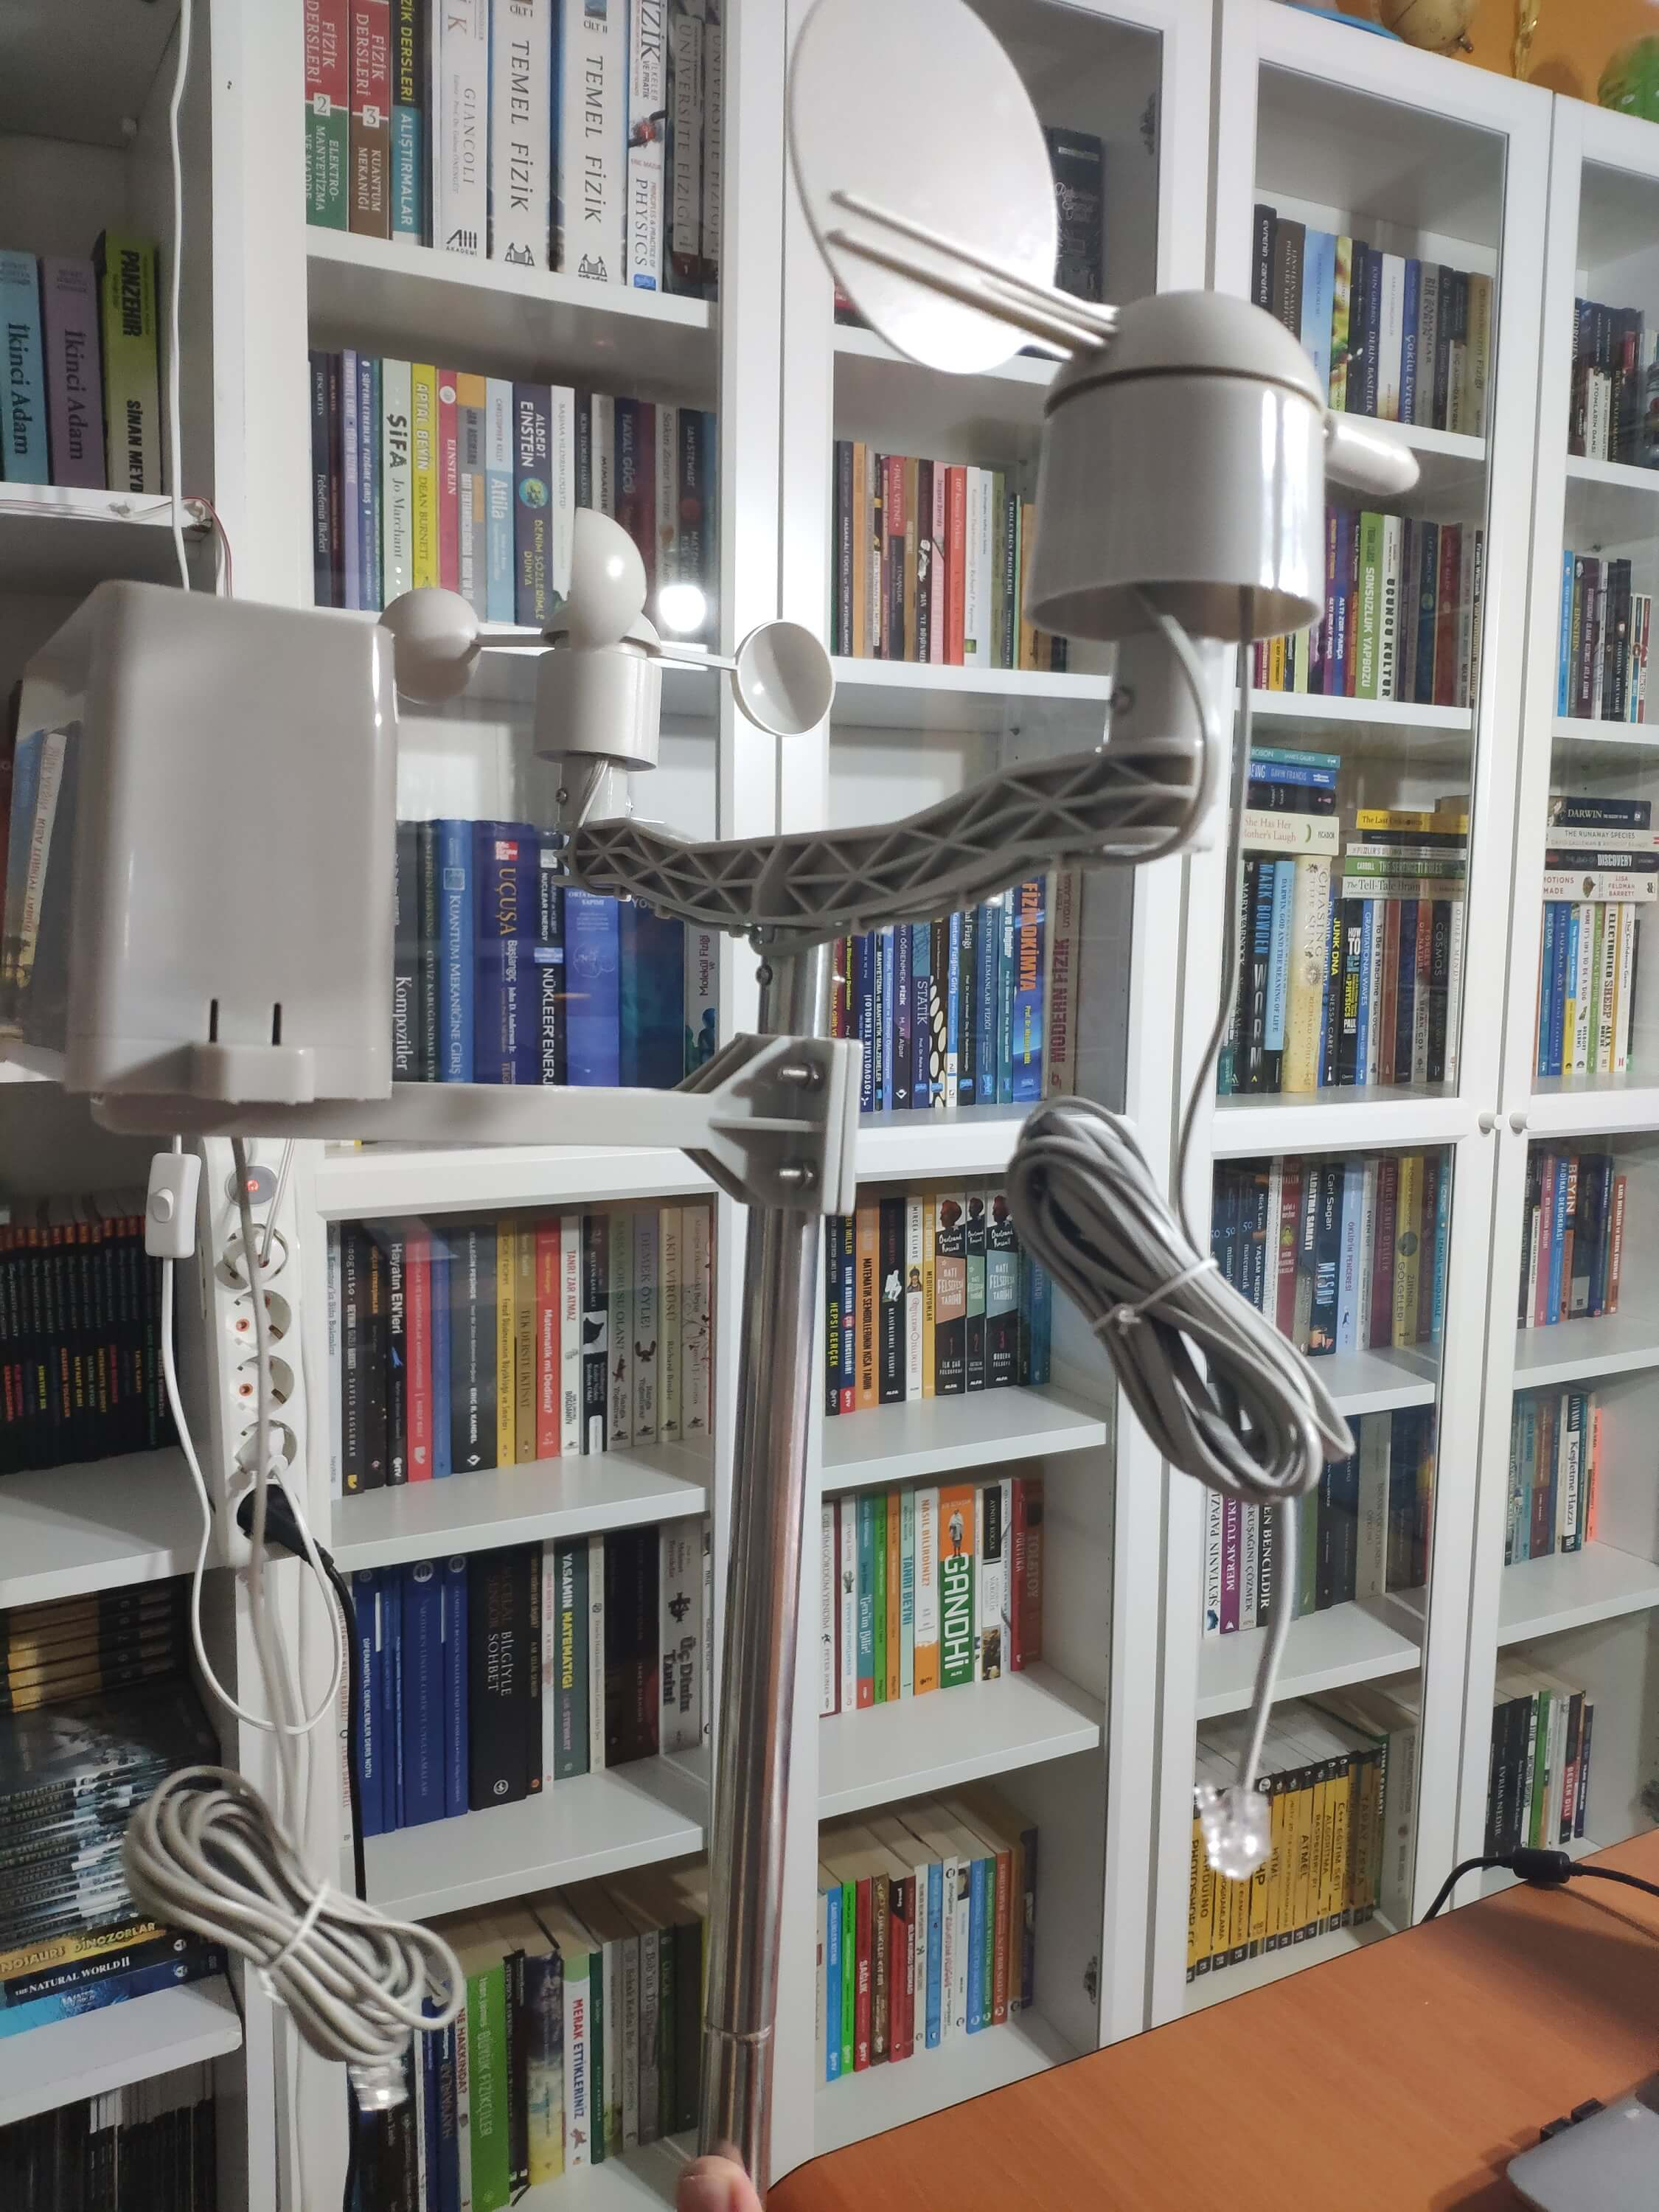
After setting up the SIM808 shield with Arduino Uno, I connected the sensor (converter) board to it.
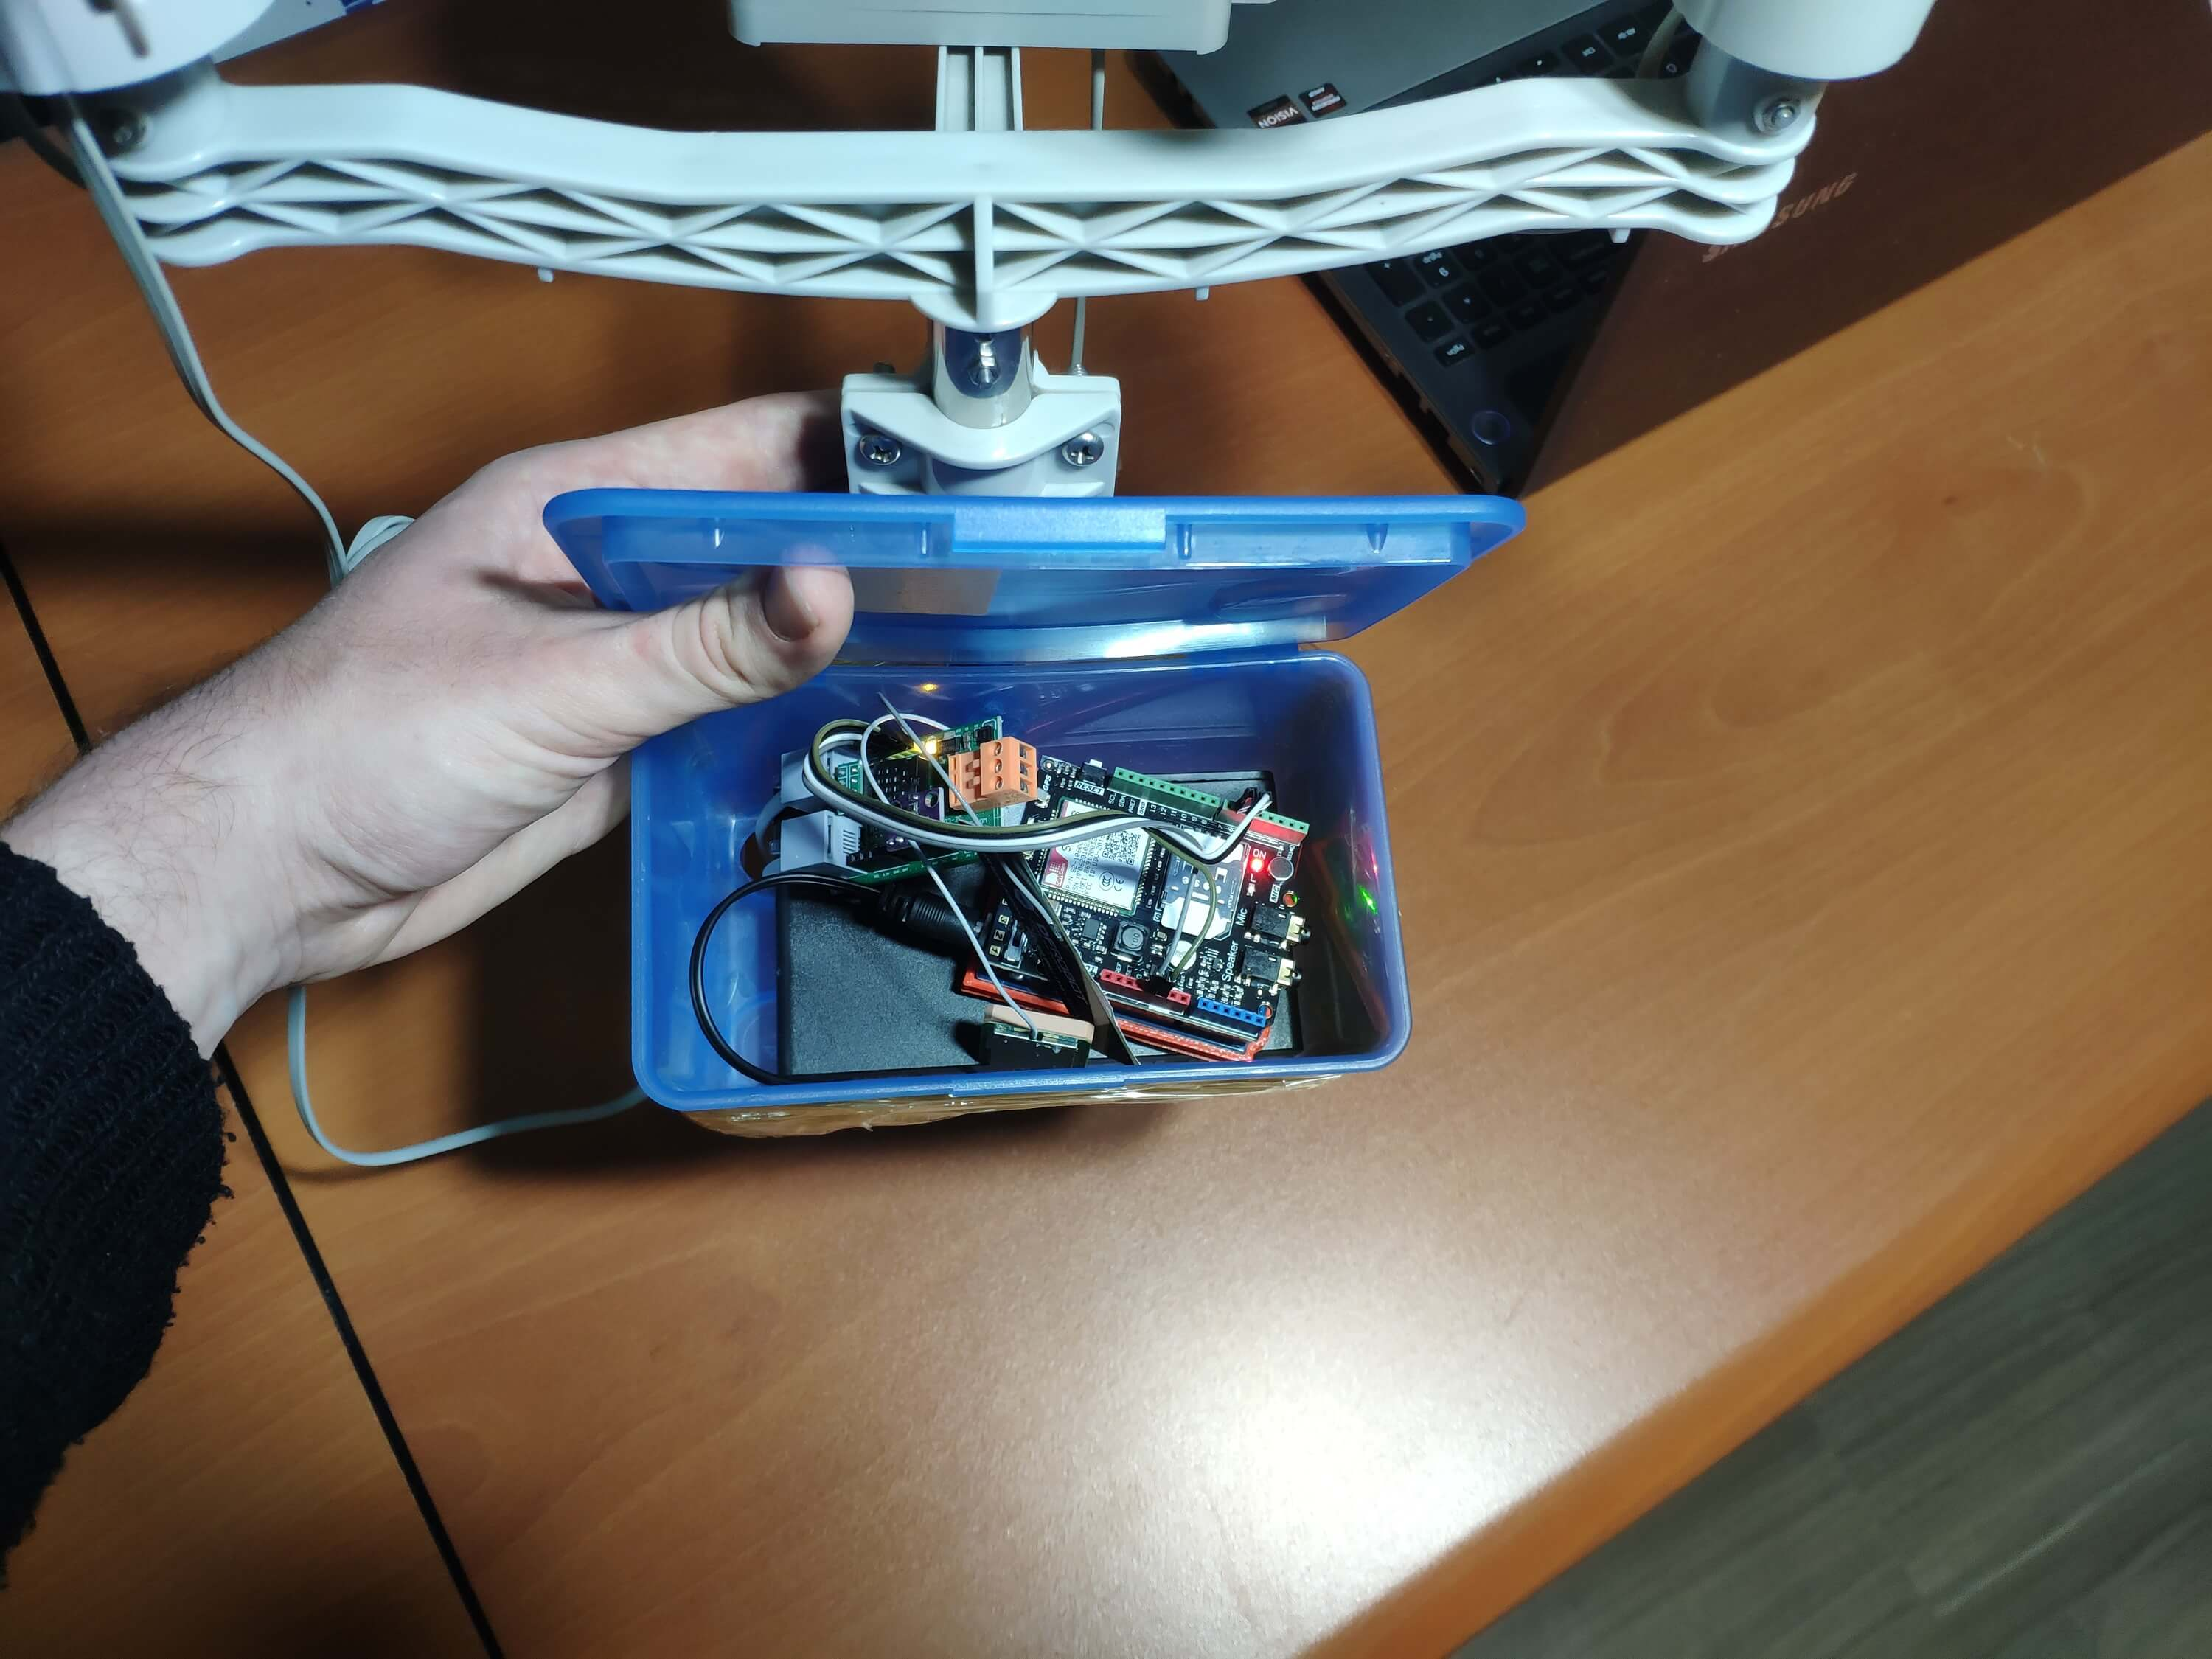
I placed all components into a plastic box to collect weather data outside, even in extreme weather conditions, since the sensor board is not weather-proof.
Then, I fastened the plastic box to the weather station.
Videos and Conclusion
After completing coding and assembling the weather station, I collated local weather data for more than three months every five minutes to build my neural network model successfully.
I am still collecting weather data at my balcony and backyard to improve my neural network model and its accuracy :)
Further Discussions
☔ 💧 Since we need local weather data sets to get more accurate predictions on weather phenomena, budget-friendly NN-enabled weather stations like this can be placed on farms and greenhouses to avert the detrimental effects of excessive rainfall on agriculture.
☔ 💧 As early warning systems working with neural networks, we can use them simultaneously to create a swarm of weather stations communicating and feeding each other to forecast rainfall intensity precisely in local areas.
☔ 💧 Also, we can utilize that information for assessing:
- vital water resources,
- agriculture,
- crop productivity,
- ecosystems,
- hydrology.
References
[1] Extreme weather - heavy rainfall , NIWA, https://niwa.co.nz/natural-hazards/extreme-weather-heavy-rainfall
[2] University of Illinois at Urbana-Champaign, News Bureau. "Excessive rainfall as damaging to corn yield as extreme heat, drought. " ScienceDaily. ScienceDaily, 30 April 2019. www.sciencedaily.com/releases/2019/04/190430121744.htm.
[3] Andrew Culclasure, Using Neural Networks to Provide Local Weather Forecasts , Georgia Southern University, Spring 2013, 29https://digitalcommons.georgiasouthern.edu/cgi/viewcontent.cgi?article=1031&context=etd.
Kode
- IoT_weather_station_neural_network.py
- ESP12E_remote_weather_station.ino
- SIM808_remote_weather_station.ino
- index.php (web application)
- account_verification_token.php (web application)
IoT_weather_station_neural_network.pyPython
# IoT Weather Station Predicting Rainfall Intensity w/ TensorFlow# Windows, Linux, or Ubuntu# By Kutluhan Aktar# Collates weather data on Google Sheets and interprets it with a neural network built in TensorFlow to make predictions on the rainfall intensity. # For more information:# https://www.theamplituhedron.com/projects/IoT_Weather_Station_Predicting_Rainfall_Intensity_with_TensorFlowimport tensorflow as tffrom tensorflow import kerasimport matplotlib.pyplot as pltimport numpy as npimport pandas as pd# Create a class to build a neural network after getting, visualizing, and scaling (normalizing) weather data.class Weather_Station:def __init__(self, data):self.df =data self.input =[] self.label =[] # Define class names for different rainfall intensity predictions and values. self.class_names =['None', 'Light Rain', 'Moderate Rain', 'Heavy Rain', 'Violent Rain'] # Create graphics for requested columns. def graphics(self, column_1, column_2, xlabel, ylabel):# Show requested columns from the data set:plt.style.use("dark_background") plt.gcf().canvas.set_window_title('IoT Weather Station') plt.hist2d(self.df[column_1], self.df[column_2]) plt.colorbar() plt.xlabel(xlabel) plt.ylabel(ylabel) plt.title(xlabel) plt.show() # Visualize data before creating and feeding the neural network model. def data_visualization(self):# Inspect requested columns to build a model with appropriately formatted data:self.graphics('WD', '1h_RF', 'Wind Direction (deg)', 'One-Hour Rainfall (mm)') self.graphics('Av_WS', '1h_RF', 'Average Wind Speed (m/s)', 'One-Hour Rainfall (mm)') self.graphics('Mx_WS', '1h_RF', 'Maximum Wind Speed (m/s)', 'One-Hour Rainfall (mm)') self.graphics('24h_RF', '1h_RF', '24-Hour Rainfall (mm)', 'One-Hour Rainfall (mm)') self.graphics('Tem', '1h_RF', 'Temperature (C)', 'One-Hour Rainfall (mm)') self.graphics('Hum', '1h_RF', 'Humidity (%)', 'One-Hour Rainfall (mm)') self.graphics('b_PR', '1h_RF', 'Barometric Pressure (hPA)', 'One-Hour Rainfall (mm)') # Scale (normalize) data depending on the neural network model. def scale_data(self):# Wind Direction and Speed:wv =self.df.pop('Av_WS') max_wv =self.df.pop('Mx_WS') # Convert to radians. wd_rad =self.df.pop('WD')*np.pi / 180 # Calculate the wind x and y components. self.df['scaled_WX'] =wv*np.cos(wd_rad) self.df['scaled_WY'] =wv*np.sin(wd_rad) # Calculate the max wind x and y components. self.df['scaled_max_WX'] =max_wv*np.cos(wd_rad) self.df['scaled_max_WY'] =max_wv*np.sin(wd_rad) # Temperature:tem =self.df.pop('Tem') self.df['scaled_Tem'] =tem / 25 # Humidity:hum =self.df.pop('Hum') self.df['scaled_Hum'] =hum / 70 # Barometric Pressure:bPR =self.df.pop('b_PR') self.df["scaled_bPR"] =bPR / 1013 # 24 Hour Rainfall (Approx.) rain_24 =self.df.pop('24h_RF') self.df['scaled_24h_RF'] =rain_24 / 24 # Define the input and label arrays. def create_input_and_label(self):n =len(self.df) # Create the input array using the scaled variables:for i in range(n):self.input.append(np.array([self.df['scaled_WX'][i], self.df['scaled_WY'][i], self.df['scaled_max_WX'][i], self.df['scaled_max_WY'][i], self.df['scaled_Tem'][i], self.df['scaled_Hum'][i], self.df['scaled_bPR'][i]])) self.input =np.asarray(self.input) # Create the label array using the one-hour and 24-hour rainfall variables:for i in range(n):_class =0 # Evaluate the approximate rainfall rate:approx_RF_rate =(self.df['1h_RF'][i] + self.df['scaled_24h_RF'][i]) * 100 # As labels, assign classes of rainfall intensity according to the approximate rainfall rate (mm):if approx_RF_rate ==0:_class =0 elif approx_RF_rate <2.5:_class =1 elif 2.5 ", self.class_names[np.argmax(prediction[i])]) # Save the model for further usage without training steps:def save_model(self):self.model.save("E:\PYTHON\weather_station.h5") # Run Artificial Neural Network (ANN):def Neural_Network(self, save):self.scale_data() self.create_input_and_label() self.split_data() self.build_and_train_model() if save ==True:self.save_model() # Example Input and Layer:print("\nScaled Input [EXP]:\n") print(self.train_input[0]) print("\nScaled Label [EXP]:\n") print(self.train_label[0]) # Read data (Remote Weather Station.csv):csv_path ="E:\PYTHON\Remote Weather Station.csv"df =pd.read_csv(csv_path)# Define a new class object named 'station':station =Weather_Station(df)# Visualize data:#station.data_visualization()# Artificial Neural Network (ANN):station.Neural_Network(False)# Enter inputs for making predictions:prediction_array =np.array([ [0, 0, 0.31819805, 0.31819805, 0.6988, 0.81498571, 0.99349753], [0, -0, 0, -0, 0.8444, 1, 0.96835143], [0, 0, 0.45, 0, 0.87577, 0.95857143, 1.00128332], [-0, -0, -0, -0, 0.8224, 1.05714286, 0.99279368]])# Prediction Results:station.make_prediction(prediction_array) ESP12E_remote_weather_station.inoArduino
///////////////////////////////////////////// // IoT Weather Station Predicting // // Rainfall Intensity w/ TensorFlow // // ------------------------ // // NodeMCU (ESP-12E) // // by Kutluhan Aktar // // // ///////////////////////////////////////////////// Collates weather data on Google Sheets and interprets it with a neural network built in TensorFlow to make predictions on the rainfall intensity. //// For more information:// https://www.theamplituhedron.com/projects/IoT_Weather_Station_Predicting_Rainfall_Intensity_with_TensorFlow//// Connections// NodeMCU (ESP-12E) :// Weather Station// VV --------------------------- 5V// D5 --------------------------- RX// D6 --------------------------- TX// G --------------------------- GND// Include required libraries:#include #include #include #include #include // Define your WiFi settings.const char *ssid ="";const char *password ="";// Define weather station settings:char databuffer[35];double temp;int transferring =0;// Define the serial connection pins - RX and TX.SoftwareSerial Serial_1(D6, D5); // (Rx, Tx)void setup() { // Wait until connected. penundaan (1000); // Initiate serial ports:Serial.begin(115200); Serial_1.begin(9600); // It is just for assuring if connection is alive. WiFi.mode(WIFI_OFF); penundaan (1000); // This mode allows NodeMCU to connect any WiFi directly. WiFi.mode(WIFI_STA); // Connect NodeMCU to your WiFi. WiFi.begin(ssid, password); Serial.print("\n\n"); Serial.print("Try to connect to WiFi. Please wait! "); Serial.print("\n\n"); // Halt the code until connected to WiFi. while (WiFi.status() !=WL_CONNECTED) { delay(500); Serial.print("*"); } // If connection is successful:Serial.print("\n\n"); Serial.print("-------------------------------------"); Serial.print("\n\n"); Serial.print("Connection is successful!"); Serial.print("\n\n"); Serial.print("Connected WiFi SSID :"); Serial.print(ssid); Serial.print("\n\n"); Serial.println("Connected IPAddress :"); Serial.println(WiFi.localIP()); Serial.print("\n\n");}void loop() { // Get data from the remote weather station:getBuffer(); // Debug the information and create the link:String weather_data ="wd=" + String(WindDirection()) + "&a_ws=" + String(WindSpeedAverage()) + "&m_ws=" + String(WindSpeedMax()) + "&1_rf=" + String(RainfallOneHour()) + "&24_rf=" + String(RainfallOneDay()) + "&tem=" + String(Temperature()) + "&hum=" + String(Humidity()) + "&b_pr=" + String(BarPressure()); String server ="http://192.168.1.24/remote_weather_station/?"; Serial.println("Weather Data => " + weather_data); Serial.println("Buffer => " + String(databuffer)); // Send data packets every 5 minutes to Raspberry Pi (or any server). transferring++; Serial.println("Time => " + String(transferring) + "s / " + String(int(5*60)) + "s\n\n"); if(transferring ==5*60){ // Create the HTTP object to make a request to the server. HTTPClient http; http.begin(server + weather_data); int httpCode =http.GET(); String payload =http.getString(); Serial.println("Data Send...\nHTTP Code => " + String(httpCode) + "\nServer Response => " + payload + "\n\n"); http.end(); transferring =0; } // Wait 1 second... delay(1000);}// WEATHER STATIONvoid getBuffer(){ int index; for (index =0;index <35;index ++){ if(Serial_1.available()){ databuffer[index] =Serial_1.read(); if (databuffer[0] !='c'){ index =-1; } } else{ index --; } }}int transCharToInt(char *_buffer, int _start, int _stop){ int _index; int result =0; int num =_stop - _start + 1; int _temp[num]; for (_index =_start;_index <=_stop;_index ++){ _temp[_index - _start] =_buffer[_index] - '0'; result =10*result + _temp[_index - _start]; } return result;}int WindDirection(){ return transCharToInt(databuffer,1,3); } // Wind Direction (deg)float WindSpeedAverage(){ temp =0.44704 * transCharToInt(databuffer,5,7); return temp; } // Average Air Speed (1 minute)float WindSpeedMax(){ temp =0.44704 * transCharToInt(databuffer,9,11); return temp; } //Max Air Speed (5 minutes)float Temperature(){ temp =(transCharToInt(databuffer,13,15) - 32.00) * 5.00 / 9.00; return temp; } // Temperature ("C")float RainfallOneHour(){ temp =transCharToInt(databuffer,17,19) * 25.40 * 0.01; return temp; } // Rainfall (1 hour)float RainfallOneDay(){ temp =transCharToInt(databuffer,21,23) * 25.40 * 0.01; return temp; } // Rainfall (24 hours)int Humidity(){ return transCharToInt(databuffer,25,26); } // Humidity (%)float BarPressure(){ temp =transCharToInt(databuffer,28,32); return temp / 10.00; } // Barometric Pressure (hPA)
SIM808_remote_weather_station.inoArduino
///////////////////////////////////////////// // IoT Weather Station Predicting // // Rainfall Intensity w/ TensorFlow // // ------------------------ // // Arduino Uno (SIM808) // // by Kutluhan Aktar // // // ///////////////////////////////////////////////// Collates weather data on Google Sheets and interprets it with a neural network built in TensorFlow to make predictions on the rainfall intensity. //// For more information:// https://www.theamplituhedron.com/projects/IoT_Weather_Station_Predicting_Rainfall_Intensity_with_TensorFlow//// Connections// Arduino Uno:// SIM808 GPS/GPRS/GSM Shield For Arduino// D0 --------------------------- RX// D1 --------------------------- TX// D12 --------------------------- POWER // Weather Station// 5V --------------------------- 5V// D5 --------------------------- RX// D6 --------------------------- TX// GND --------------------------- GND// Include required libraries:#include #include // Define the sim808.DFRobot_SIM808 sim808(&Serial);// Define weather station settings:char databuffer[35];double temp;int transferring =0;// Define the serial connection pins - RX and TX.SoftwareSerial Serial_1(6, 5); // (Rx, Tx)void setup() { // Wait until connected. penundaan (1000); // Initiate serial ports:Serial.begin(9600); Serial_1.begin(9600); //******** Initialize sim808 module ************* while(!sim808.init()) { delay(1000); Serial.print("Sim808 init error\r\n"); } delay(2000); // Continue if the SIM808 Module is working accurately. Serial.println("Sim808 init success"); delay(5000);}void loop() { // Get data from the remote weather station:getBuffer(); // Debug the information and create the link:String weather_data_1 ="wd=" + String(WindDirection()) + "&a_ws=" + String(WindSpeedAverage()) + "&m_ws=" + String(WindSpeedMax()); String weather_data_2 ="&1_rf=" + String(RainfallOneHour()) + "&24_rf=" + String(RainfallOneDay()) + "&tem=" + String(Temperature()); String weather_data_3 ="&hum=" + String(Humidity()) + "&b_pr=" + String(BarPressure()); Serial.print("Weather Data => " + weather_data_1); Serial.print(weather_data_2); Serial.println(weather_data_3); Serial.println("Buffer => " + String(databuffer)); // Send data packets every 5 minutes to the server. transferring++; Serial.println("Time => " + String(transferring) + "s / " + String(int(5*60)) + "s\n\n"); if(transferring ==5*60){ //*********** Attempt DHCP ******************* while(!sim808.join(F("cmnet"))) { Serial.println("Sim808 join network error!"); penundaan(2000); } //************ Successful DHCP **************** delay(5000); Serial.println("Successful DHCP"); //*********** Establish a TCP connection ************ if(!sim808.connect(TCP,"192.168.1.24", 80)) { // Change it with your server. Serial.println("Connection Error"); }else{ Serial.println("Connection OK"); } delay(2000); //*********** Send a GET request ***************** String line ="GET /remote_weather_station/?" + weather_data_1 + weather_data_2 + weather_data_3 + " HTTP/1.0\r\n\r\n"; Serial.println(baris); char buffer[512]; // Convert the line from string to char array to make an HTTP Get Request with the SIM808. char web_hook[110]; String_to_Char(line, 110, web_hook); sim808.send(web_hook, sizeof(web_hook)-1); while (true) { int ret =sim808.recv(buffer, sizeof(buffer)-1); if (ret <=0){ Serial.println("Fetch Over..."); merusak; } // Uncomment to view the response in the serial monitor. /* buffer[ret] ='\0'; Serial.print("Recv:"); Serial.print(ret); Serial.print(" bytes:"); Serial.println(buffer); */ Serial.println("\nData Send"); merusak; } //************* Close TCP or UDP connections ********** sim808.close(); //*** Disconnect wireless connection, Close Moving Scene ******* sim808.disconnect(); // Exit. transferring =0; } // Wait 1 second... delay(1000);}// WEATHER STATIONvoid getBuffer(){ int index; for (index =0;index <35;index ++){ if(Serial_1.available()){ databuffer[index] =Serial_1.read(); if (databuffer[0] !='c'){ index =-1; } } else{ index --; } }}int transCharToInt(char *_buffer, int _start, int _stop){ int _index; int result =0; int num =_stop - _start + 1; int _temp[num]; for (_index =_start;_index <=_stop;_index ++){ _temp[_index - _start] =_buffer[_index] - '0'; result =10*result + _temp[_index - _start]; } return result;}int WindDirection(){ return transCharToInt(databuffer,1,3); } // Wind Direction (deg)float WindSpeedAverage(){ temp =0.44704 * transCharToInt(databuffer,5,7); return temp; } // Average Air Speed (1 minute)float WindSpeedMax(){ temp =0.44704 * transCharToInt(databuffer,9,11); return temp; } //Max Air Speed (5 minutes)float Temperature(){ temp =(transCharToInt(databuffer,13,15) - 32.00) * 5.00 / 9.00; return temp; } // Temperature ("C")float RainfallOneHour(){ temp =transCharToInt(databuffer,17,19) * 25.40 * 0.01; return temp; } // Rainfall (1 hour)float RainfallOneDay(){ temp =transCharToInt(databuffer,21,23) * 25.40 * 0.01; return temp; } // Rainfall (24 hours)int Humidity(){ return transCharToInt(databuffer,25,26); } // Humidity (%)float BarPressure(){ temp =transCharToInt(databuffer,28,32); return temp / 10.00; } // Barometric Pressure (hPA)void String_to_Char(String _String, int _size, char _convert[]){ for(int i=0;i<_size;i++){ _convert[i] =_String[i]; }}
index.php (web application)PHP
 (int)$_GET['wd'], "a_ws" => (float)$_GET['a_ws'], "m_ws" => (float)$_GET['m_ws'], "1_rf" => (float)$_GET['1_rf'], "24_rf" => (float)$_GET['24_rf'], "tem" => (float)$_GET['tem'], "hum" => (int)$_GET['hum'], "b_pr" => (float)$_GET['b_pr'] ];}else{ $variables_from_module =[ "wd" => "err", "a_ws" => "err", "m_ws" => "err", "1_rf" => "err", "24_rf" => "err", "tem" => "err", "hum" => "err", "b_pr" => "err" ];}/** * Returns an authorized API client. * @return Google_Client the authorized client object */function getClient(){ $client =new Google_Client(); $client->setApplicationName('Remote Weather Station'); // Enter your application name. $client->setScopes('https://www.googleapis.com/auth/spreadsheets'); $client->setAuthConfig('credentials.json'); $client->setAccessType('offline'); $client->setPrompt('select_account consent'); // Load previously authorized token from a file, if it exists. // The file token.json stores the user's access and refresh tokens, and is // created automatically when the authorization flow completes for the first // time. $tokenPath ='token.json'; if (file_exists($tokenPath)) { $accessToken =json_decode(file_get_contents($tokenPath), true); $client->setAccessToken($accessToken); print("Token Found!"); } // If there is no previous token or it's expired. if ($client->isAccessTokenExpired()) { // Refresh the token if possible, else fetch a new one. if ($client->getRefreshToken()) { $client->fetchAccessTokenWithRefreshToken($client->getRefreshToken()); } else { // Request authorization from the user. $authUrl =$client->createAuthUrl(); // Do not forget to refresh the page after getting the verification code and entering it to the account_verification_token.php. printf("Open the following link in your browser:

%s

", $authUrl); // <=Comment print 'Do not forget to refresh the page after getting the verification code and entering it to the account_verification_token.php.

Set the verification code in the account_verification_token.php file.'; // <=Comment // Set the verification code to create the token.json. $authCode =trim($GLOBALS['account_verification_token']); // Exchange authorization code for an access token. $accessToken =$client->fetchAccessTokenWithAuthCode($authCode); $client->setAccessToken($accessToken); // Check to see if there was an error and the account_verification_token is entered. if (array_key_exists('error', $accessToken)) { throw new Exception(join(', ', $accessToken)); }else{ print("Successful! Refresh the page."); } } // Save the token to a file. if (!file_exists(dirname($tokenPath))) { mkdir(dirname($tokenPath), 0700, true); } file_put_contents($tokenPath, json_encode($client->getAccessToken())); } return $client;}// Get the API client and construct the service object.$client =getClient();$service =new Google_Service_Sheets($client);// Enter your spreadsheetId:$spreadsheetId ='';// Enter the range (the first row) under which new values will be appended (8 rows):$range ='A1:H1';// Append recent findings from the weather station to the spreadsheet.$values =[ [$variables_from_module["wd"], $variables_from_module["a_ws"], $variables_from_module["m_ws"], $variables_from_module["1_rf"], $variables_from_module["24_rf"], $variables_from_module["tem"], $variables_from_module["hum"], $variables_from_module["b_pr"]]];$body =new Google_Service_Sheets_ValueRange([ 'values' => $values]);$params =[ 'valueInputOption' => "RAW"];// Append if only requested!if(isset($_GET['wd']) &&isset($_GET['a_ws']) &&isset($_GET['m_ws']) &&isset($_GET['1_rf']) &&isset($_GET['24_rf']) &&isset($_GET['tem']) &&isset($_GET['hum']) &&isset($_GET['b_pr'])){ $result =$service->spreadsheets_values->append($spreadsheetId, $range, $body, $params); printf("

%d cells appended.", $result->getUpdates()->getUpdatedCells());}else{ print ("
Missing Data!");}
account_verification_token.php (web application)PHP
"; // Enter the verification code after authorization. ?>
Suku cadang dan penutup khusus
remote_weather_station_OobOCQNPSW.csv Skema