

Proses manufaktur

Manufaktur industri
Analisis dengan Spektrometri Fluoresensi Sinar-X
Fluoresensi sinar-X (XRF), adalah teknik spektroskopi emisi yang telah menemukan aplikasi luas di bidang identifikasi dan penentuan unsur. Teknik ini bergantung pada emisi karakteristik radiasi x, biasanya dalam rentang energi 1 keV hingga 60 keV, mengikuti eksitasi tingkat energi elektron atom oleh sumber energi eksternal, seperti berkas elektron, berkas partikel bermuatan, atau sinar x -sinar sinar. Dalam kebanyakan matriks sampel, spektrometri sinar-x dapat mendeteksi unsur-unsur pada konsentrasi kurang dari 1 mikrogram/g sampel (1 ppm). Dalam sampel film tipis, ia dapat mendeteksi jumlah total beberapa persepuluh dari satu mikrogram. Awalnya, spektrometri sinar-x diterima secara luas dalam aplikasi yang berkaitan dengan analisis metalurgi dan geokimia. Baru-baru ini, spektrometri sinar-x telah terbukti bermanfaat dalam analisis sampel lingkungan, dalam penentuan elemen belerang dan aus dalam produk minyak bumi, dalam aplikasi yang melibatkan sampel forensik, dan dalam pengukuran material elektronik dan yang terkait dengan komputer.
Spektrometri fluoresensi sinar-X (XRF) adalah alat yang serbaguna dalam banyak masalah analitis. Elemen mayor, minor, dan trace dapat ditentukan secara kualitatif dan kuantitatif dalam berbagai jenis sampel seperti logam, paduan, gelas, semen, mineral, batuan, bijih, polimer, serta bahan lingkungan dan biologis. Unsur-unsur dari natrium (Na) hingga uranium (U) secara rutin ditentukan menggunakan spektrometer fluoresensi sinar-x dispersif energi (EDXRF), sedangkan penerapan spektrometer fluoresensi sinar-x dispersif panjang gelombang (WDXRF) memungkinkan penentuan elemen-Z rendah secara efisien hingga bahkan berilium (Be). Meskipun sampel dapat dianalisis tanpa perlakuan, hasil berkualitas tinggi dapat dipastikan jika preparasi sampel yang tepat diterapkan. Ini dapat bervariasi dari pembersihan sederhana dan pemolesan sampel (logam, paduan), pembubukan dan pembuatan pelet dengan atau tanpa pengikat (keramik, mineral, bijih, tanah, dll.), menggabungkan sampel dengan fluks yang sesuai (keramik, batu, bijih, dll) untuk pencernaan dengan asam (logam, paduan). Dengan cara ini kesalahan akibat kekasaran permukaan, efek ukuran partikel, atau ketidakhomogenan bahan dapat dihilangkan atau diminimalkan.
Roentgen menemukan sinar-x pada tahun 1895. H.G.J. Moseley mengembangkan hubungan antara struktur atom dan emisi sinar-x dan pada tahun 1913 menerbitkan spektrum sinar-x pertama, yang merupakan dasar untuk spektrometri sinar-x modern. Moseley mengenali potensi penentuan unsur kuantitatif menggunakan teknik sinar-x. Perkembangan instrumentasi sinar-x rutin, yang mengarah ke spektrometer sinar-x yang dikenal saat ini, berlangsung selama beberapa dekade berikutnya. Coolidge merancang tabung sinar-x pada tahun 1913 yang serupa dengan yang digunakan saat ini. Soller mencapai kolimasi sinar-x pada tahun 1924. Perbaikan dalam detektor sinar-x gas oleh Geiger dan Mueller pada tahun 1928 akhirnya mengarah pada desain WDXRF komersial pertama oleh Friedman dan Birks pada tahun 1948. Baru-baru ini, detektor lain, seperti germanium dan detektor semi-konduktor silikon yang didoping lithium telah menghasilkan desain spektrometer sinar-x yang dimodifikasi. Instrumentasi dispersi energi modern memfasilitasi identifikasi kualitatif elemen dalam berbagai sampel. Kandungan informasi spektrum sinar-x dispersif energi adalah salah satu yang tertinggi yang dapat diperoleh dari bahan anorganik dalam satu pengukuran. Posisi dan intensitas puncak spektral memberikan informasi kualitatif dan kuantitatif, dan intensitas latar belakang menghasilkan informasi tentang komposisi massal matriks sampel.
Spektrometri sinar-X adalah salah satu dari sedikit teknik yang dapat diterapkan pada sampel padat dari berbagai bentuk. Meskipun sebagian besar spektrometer XRF digunakan di laboratorium, banyak yang menemukan aplikasi dalam analisis rutin untuk produksi dan kontrol kualitas dan dalam tugas khusus. Diagram struktural spektrometer EDXRF diberikan pada Gambar 1.
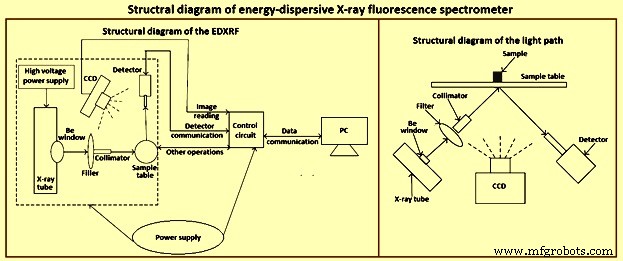
Gbr 1 Diagram struktur spektrometer EDXRF
Radiasi elektromagnetik
Radiasi elektromagnetik adalah bentuk energi yang dapat disebarkan melalui ruang dan dapat berinteraksi dengan atom dan molekul untuk mengubah keadaan energinya. Kedua sifat ini penting untuk spektroskopi. Radiasi elektromagnetik menunjukkan perilaku yang membutuhkan dua teori untuk menjelaskan. Teori gelombang menggambarkan perilaku radiasi elektromagnetik, seperti pembiasan, refleksi, difraksi, dan hamburan. Radiasi didefinisikan sebagai bentuk energi yang terdiri dari dua gelombang ortogonal, masing-masing memiliki frekuensi dan panjang gelombang yang sama. Salah satunya adalah medan listrik yang berosilasi, dan yang lainnya adalah medan magnet yang berosilasi, sehingga menghasilkan istilah radiasi elektromagnetik.
Dalam ruang hampa, kecepatan rambat gelombang melalui ruang adalah kecepatan cahaya (c =3 × 10 pangkat 10 cm/s). Ini mengarah pada hubungan fundamental penting yang diwakili oleh persamaan w.v =c. Ungkapan ini menyatakan bahwa produk dari panjang gelombang (w) radiasi elektromagnetik dan frekuensinya (v) sama dengan kecepatannya. Panjang gelombang radiasi elektromagnetik bervariasi pada banyak orde besarnya. Misalnya, gelombang radio dalam pita siaran AM normal memiliki panjang gelombang beberapa ratus meter dan panjang gelombang ultraviolet berada dalam kisaran 10 nm hingga 100 nm (nanometer). Sebaliknya, sinar-x yang berguna dalam rentang spektroskopi dari 0,01 nm hingga 10 nm (Gbr 2).
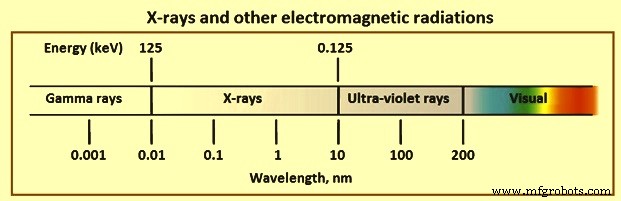
Gambar 2 sinar-X dan radiasi elektromagnetik lainnya
Untuk spektrometri dispersi panjang gelombang, seringkali lebih mudah menggunakan satuan panjang gelombang, tetapi untuk spektrometri sinar-x dispersif energi (EDS), deskripsi energi lebih mudah digunakan. Namun, antar konversi sederhana.
Beberapa deskripsi karakteristik sinar-x yang biasanya digunakan adalah signifikan. Arti yang tepat dari intensitas radiasi elektromagnetik adalah energi per satuan luas per satuan waktu; namun, jumlah hitungan per satuan waktu dari detektor sering digunakan sebagai intensitas. Karena area adalah area aktif dari detektor yang digunakan, dan waktu adalah parameter yang dapat diatur, penggunaan count adalah deskripsi praktis dari intensitas sinar-x. Istilah sinar-x keras atau lunak sering digunakan untuk membedakan sinar-x dengan panjang gelombang pendek (0,01 nm hingga 0,1 nm) dan panjang (0,1 nm hingga 1 nm). Radiasi X jatuh di wilayah spektrum elektromagnetik berenergi tinggi.
Emisi sinar-X
Sinar-X dihasilkan dari gangguan orbital elektron atom. Ini dapat dilakukan dengan beberapa cara, yang paling umum adalah pemboman elemen target dengan elektron berenergi tinggi, sinar-x, atau partikel bermuatan yang dipercepat. Dua yang pertama sering digunakan dalam spektrometri sinar-x secara langsung atau tidak langsung. Pemboman elektron menghasilkan kontinum energi sinar-x serta karakteristik radiasi dari elemen target. Kedua jenis radiasi ditemui dalam spektrometri sinar-x.
Lanjutan – Emisi sinar-x dengan fungsi intensitas yang kontinu dan halus relatif terhadap energi disebut radiasi kontinum, atau bremsstrahlung. Sebuah kontinum sinar-x dapat dihasilkan dalam beberapa cara. Namun, yang paling berguna adalah berkas elektron yang digunakan untuk membombardir target dalam tabung sinar-x. Kontinum dihasilkan sebagai akibat dari perlambatan progresif elektron berenergi tinggi yang mengenai target, yang merupakan distribusi elektron orbital dari berbagai energi. Saat elektron yang menumbuk berinteraksi dengan elektron orbital terikat, sebagian energi kinetiknya diubah menjadi radiasi. Jumlah yang dikonversi tergantung pada energi ikat elektron yang terlibat. Oleh karena itu, ada kemungkinan yang agak statistik mengenai berapa banyak energi yang dikonversi dengan setiap interaksi.
Probabilitas elektron yang menumbuk berinteraksi dengan elektron orbital dari elemen target meningkat dengan nomor atom elemen, dengan demikian, intensitas emisi kontinum meningkat dengan nomor atom elemen target. Selanjutnya, kemungkinan interaksi meningkat dengan jumlah elektron per satuan waktu dalam berkas, atau fluks. Oleh karena itu, intensitas kontinum meningkat dengan arus berkas elektron, dinyatakan dalam mili-ampere. Selain itu, kemampuan elektron yang menumbuk untuk berinteraksi dengan elektron yang terikat erat dari elemen target meningkat dengan energi kinetik dari elektron yang membombardir. Karena energi kinetik elektron dalam berkas meningkat dengan potensi percepatan, intensitas terpadu dari kontinum meningkat dengan potensi percepatan elektron, dinyatakan dalam kilovolt. Akhirnya, energi maksimum yang dimanifestasikan sebagai foton sinar-x sama dengan energi kinetik elektron yang menumbuk, yang pada gilirannya berhubungan dengan potensi percepatan. Energi intensitas maksimum dalam kontinum terletak di sekitar dua pertiga dari energi maksimum yang dipancarkan. Selanjutnya, ada penyerapan sinar-x dalam bahan target atau penyerapan oleh bahan yang digunakan untuk jendela di tabung sinar-x dan detektor. Oleh karena itu, beberapa modifikasi distribusi intensitas dapat terjadi, terutama pada energi sinar-x yang rendah.
Emisi karakteristik – Sebagian besar elektron yang menumbuk target berinteraksi dengan elektron orbital elemen target dalam interaksi non spesifik dan menghasilkan sedikit atau tidak ada gangguan pada elektron orbital dalam. Namun, beberapa interaksi menghasilkan ejeksi elektron dari orbital ini. Kekosongan yang dihasilkan, atau lubang, mewakili keadaan tidak stabil berenergi tinggi. Jika kekosongan orbital berada di kulit terdalam, elektron dari kulit terluar mengalir untuk mengisinya dan ini menghasilkan energi yang lebih rendah dan keadaan yang lebih stabil. Energi yang dilepaskan oleh proses dapat dimanifestasikan sebagai sinar-x. Setiap transisi yang dapat terjadi, mengarah pada pancaran garis-garis sinar-x yang tajam yang merupakan karakteristik dari elemen target dan transisi yang terlibat. Garis radiasi karakteristik ini dipancarkan dengan kontinum.
Penyerapan sinar-X
Sinar-X yang mengenai sampel mengalami dua interaksi penting dengan elemen sampel:absorpsi dan hamburan. Penyerapan radiasi dapat terjadi melalui interaksi spesifik yang cukup besar dalam eksitasi sampel dalam spektrometri sinar-x atau oleh interaksi yang lebih umum yang mempengaruhi intensitas sinar-x yang dipancarkan dari sampel. Hamburan sinar-x menyebabkan intensitas latar belakang dalam spektrum yang diamati.
Penyerapan massal – Ketika berkas sinar-x melewati suatu bahan, foton (medan elektromagnetik) dapat berinteraksi dengan cara yang tidak spesifik dengan elektron dalam orbital elemen target, mengurangi intensitas berkas sinar-x. Interaksi dapat menyebabkan ejeksi fotolistrik elektron atau hamburan sinar x-ray. Dalam kedua kasus, hasil keseluruhan sering digambarkan dalam bentuk penurunan eksponensial dalam intensitas dengan panjang lintasan bahan penyerap. Koefisien penyerapan massa adalah karakteristik elemen tertentu pada energi radiasi-x tertentu. Nilainya bervariasi dengan panjang gelombang radiasi-x dan nomor atom elemen target.
Efek fotolistrik adalah yang paling penting dari proses yang mengarah pada penyerapan sinar-x saat melewati materi. Efek fotolistrik adalah ejeksi elektron dari orbital unsur-unsur dalam target sinar-x. Proses ini sering menjadi kontributor utama penyerapan sinar-x dan merupakan mode eksitasi spektrum sinar-x yang dipancarkan oleh unsur-unsur dalam sampel. Terutama sebagai hasil dari proses fotolistrik, koefisien penyerapan massa menurun terus dengan meningkatnya energi dari insiden x-radiasi. Kurva penyerapan versus energi untuk elemen tertentu memiliki diskontinuitas yang tajam. Ini dihasilkan dari energi karakteristik di mana proses fotolistrik sangat efisien.
Menyebar – Ketika foton sinar-x menumbuk kumpulan atom, foton dapat berinteraksi dengan elektron dari elemen target untuk menghasilkan hamburan foton sinar-x, seperti yang diilustrasikan pada Gambar 3. Hamburan sinar-x dari sampel adalah sumber utama sinyal latar belakang dalam spektrum yang diperoleh dalam spektrometri sinar-x. Hamburan sinar-x terutama disebabkan oleh elektron terluar yang terikat lemah dari unsur-unsur. Jika tumbukan elastis, hamburan terjadi tanpa kehilangan energi dan dikenal sebagai hamburan Rayleigh. Jika tidak elastis, foton sinar-x kehilangan energi untuk menyebabkan ejeksi elektron, dan hamburannya tidak koheren. Jalur foton sinar-x dibelokkan, dan foton kehilangan energi atau panjang gelombangnya lebih panjang. Ini adalah pencar Compton.
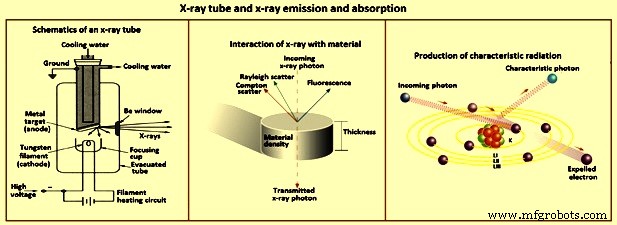
Gambar 3 Tabung sinar-X dan emisi dan penyerapan sinar-X
Scatter mempengaruhi spektrometri sinar-x dalam dua cara. Pertama, jumlah total radiasi yang tersebar meningkat dengan nomor atom karena jumlah elektron yang lebih besar. Namun, sampel dengan matriks nomor atom rendah menunjukkan hamburan yang diamati lebih besar karena berkurangnya penyerapan sendiri oleh sampel. Kedua, rasio intensitas hamburan 'Compton-to-Rayleigh' meningkat seiring dengan penurunan nomor atom matriks sampel. Kehilangan energi yang terkait dengan hamburan Compton menghasilkan perubahan panjang gelombang radiasi yang dapat diprediksi.
Hubungan antara elemen dan sinar-x
Hubungan yang berbeda antara elemen dan sinar-x ditunjukkan pada Gambar 4.
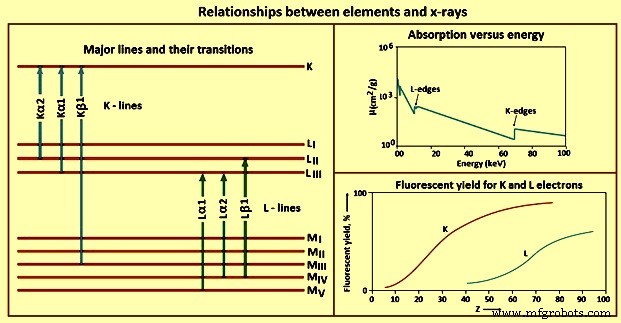
Gbr 4 Hubungan antara elemen dan sinar-x
Penyerapan – Foton sinar-X dapat berinteraksi dengan elektron orbital unsur untuk diserap atau dihamburkan. Hubungan antara penyerapan dan nomor atom unsur penting dalam memilih kondisi operasi optimal untuk spektrometri sinar-x.
Koefisien penyerapan massa berbeda untuk elemen atau zat tertentu untuk setiap elemen atau zat pada energi sinar-x tertentu dan pada setiap energi sinar-x. Karena kemungkinan interaksi yang lebih tinggi dengan elektron orbital, koefisien penyerapan massa meningkat dengan nomor atom unsur bahan target. Pada nomor atom tertentu, koefisien penyerapan massa menurun dengan panjang gelombang radiasi sinar-x. Ini dihasilkan dari energi spesifik yang diperlukan untuk ejeksi fotolistrik elektron dari orbital atom yang berbeda dan merupakan karakteristik elemen.
Tepi serapan adalah diskontinuitas atau titik kritis dalam plot penyerapan massa versus panjang gelombang atau energi insiden radiasi-x. Energi tepi serapan adalah jumlah pasti yang dikeluarkan oleh foto elektron dari orbital suatu unsur. Semakin rendah bilangan kuantum utama, semakin tinggi energi yang dibutuhkan untuk mengeluarkan elektron dari kulit itu. Panjang gelombang sinar-x yang dapat mengeluarkan elektron L lebih panjang (dengan energi lebih sedikit) daripada yang dibutuhkan untuk mengeluarkan elektron dari kulit K. Artinya, energi tepi serapan K lebih besar daripada energi tepi serapan L untuk elemen tertentu.
Emisi – Efek fotolistrik adalah mekanisme penyerapan sinar-x yang menciptakan keadaan tidak stabil dalam orbital elektron atom. Setelah kekosongan di orbital dalam terbentuk, relaksasi ke keadaan dasar yang stabil dapat terjadi dengan emisi karakteristik sinar-x dari elemen tereksitasi. Energi 1s elektron terlindung dari keadaan elektron valensi sedemikian rupa sehingga energi tepi serapan dan energi sinar-x yang dipancarkan pada dasarnya tidak bergantung pada keadaan oksidasi dan ikatan atom.
K baris – Setelah efek fotolistrik menciptakan kekosongan pada kulit K, keadaan tereksitasi menjadi rileks dengan mengisi kekosongan dengan elektron dari orbital terluar. Hanya transisi tertentu yang diperbolehkan karena aturan mekanika kuantum yang disebut aturan seleksi. Transisi yang mengikuti aturan seleksi disebut garis diperbolehkan (diagram), yang tidak disebut terlarang, dan yang menghasilkan atom dengan dua atau lebih kekosongan di orbital dalam pada saat emisi disebut satelit (non-diagram). ) garis. Jumlah garis K, dan garis tepat yang diamati untuk suatu unsur, sebagian bergantung pada jumlah orbital terisi.
Garis L – Karena rentang energi praktis untuk sebagian besar spektrometer sinar-x WDXRF adalah 0 keV hingga 100 keV, dan 0 keV hingga 40 keV untuk spektrometer EDXRF, penggunaan garis emisi selain garis K harus dipertimbangkan. Untuk elemen tertentu, garis L tereksitasi dengan energi sinar-x yang lebih rendah daripada garis K. Penggunaan garis L sangat berharga untuk unsur-unsur dengan nomor atom lebih tinggi dari sekitar 45.
M baris Garis –M menemukan aplikasi terbatas dalam spektrometri sinar-x rutin. Garis tidak diamati untuk unsur-unsur dengan nomor atom di bawah sekitar 57, dan ketika diamati, energi transisinya rendah. Satu-satunya penggunaan praktis untuk garis-garis ini adalah untuk unsur-unsur seperti torium, protaktinium, dan uranium. Mereka harus digunakan hanya dalam kasus ini untuk menghindari interferensi dengan garis L elemen lain dalam sampel.
Hasil fluoresen – Sebuah elektron dikeluarkan dari orbital atom melalui proses fotolistrik dengan dua kemungkinan hasil baik emisi foton sinar-x atau pelepasan elektron sekunder (Auger). Salah satu peristiwa ini terjadi untuk setiap atom yang tereksitasi, tetapi tidak keduanya. Oleh karena itu, produksi elektron sekunder bersaing dengan emisi foton sinar-x dari atom tereksitasi dalam sampel. Fraksi atom tereksitasi yang memancarkan sinar-x disebut hasil fluoresen. Nilai ini adalah properti elemen dan garis sinar-x yang dipertimbangkan. Unsur dengan nomor atom rendah juga memiliki hasil fluoresen yang rendah. Ditambah dengan koefisien penyerapan massa tinggi yang ditunjukkan oleh sinar-x energi rendah, deteksi dan penentuan elemen nomor atom rendah dengan spektrometri sinar-x merupakan tantangan.
Efek antar-elemen – Untuk transisi dalam spektrometri sinar-x, tidak ada garis emisi untuk deret tertentu (K, L, M) suatu elemen yang memiliki energi sama atau lebih besar dari tepi serapan deret tersebut. Hasil penting adalah bahwa sinar-x yang dipancarkan dari suatu unsur tidak dapat mengeluarkan elektron dari orbital yang sama dari atom lain dari unsur tersebut. Namun, sampel yang terdiri dari campuran elemen dapat menunjukkan interaksi yang sering disebut efek antar elemen. Interaksi elemen seperti itu dalam sampel seringkali membutuhkan analisis data khusus.
Spektrometer WDXRF
Instrumentasi spektrometri sinar-X yang diperkenalkan secara komersial pada 1950-an telah dikenal sebagai dispersi panjang gelombang yang menunjukkan bahwa radiasi yang dipancarkan dari sampel dikolimasi menggunakan kolimator Soller, kemudian mengenai kristal penganalisis. Kristal mendifraksi radiasi ke tingkat yang berbeda sesuai dengan hukum Bragg dan tergantung pada panjang gelombang atau energi radiasi-x. Dispersi sudut radiasi ini memungkinkan deteksi berurutan atau simultan dari sinar-x yang dipancarkan oleh elemen dalam sampel.
Instrumen simultan biasanya berisi beberapa set kristal analisis dan detektor; satu disesuaikan untuk setiap analit yang diinginkan dalam sampel. Meskipun mahal, instrumen ini efisien untuk penentuan rutin elemen yang dipilih sebelumnya, tetapi tidak mudah dikonversi untuk menentukan elemen selain yang dipilih saat pemasangan.
Lebih umum adalah instrumen sekuensial yang berisi sistem mekanis yang dikenal sebagai goniometer yang memvariasikan sudut antara sampel, menganalisis kristal, dan detektor. Dengan cara ini, panjang gelombang radiasi-x yang diinginkan dapat dipilih dengan menggerakkan goniometer. Spektrometer WDXRF berurutan dapat dikendalikan komputer untuk penentuan otomatis banyak elemen. Aplikasi kuantitatif spektrometer WDXRF otomatis efisien, karena instrumen dapat diprogram untuk menuju ke sudut yang benar untuk penentuan yang diinginkan. Namun, aplikasi kualitatif kurang efisien karena spektrum dipindai secara perlahan.
Tabung sinar-X – Berbagai sumber energi dapat digunakan untuk menciptakan keadaan elektronik tereksitasi dalam atom unsur yang menghasilkan emisi sinar-x. Di antaranya adalah berkas elektron, berkas partikel bermuatan, dan radiasi-x. Berkas elektron diarahkan pada sampel dalam teknik seperti pemindaian mikroskop elektron (SEM) dan analisis mikroskop elektron. Namun, penggunaan berkas elektron membutuhkan vakum tinggi untuk menghindari kehilangan energi elektron. Spektrometri sinar-X paling baik digunakan sebagai alat analisis serbaguna daripada sebagai alat khusus. Banyak sampel tidak cocok untuk vakum tinggi atau non-konduktor, yang menyebabkan masalah pengisian listrik saat berada di bawah berkas elektron. Oleh karena itu, sumber energi ini tidak praktis untuk spektrometri sinar-x.
Isotop radioaktif yang memancarkan sinar-x adalah kemungkinan lain untuk eksitasi atom untuk memancarkan sinar-x. Namun, fluks sinar-x dari sumber isotop yang dapat ditangani dengan aman di laboratorium terlalu lemah untuk penggunaan praktis. Karena sumber-sumber ini biasanya hanya memancarkan beberapa garis sinar-x yang sempit, beberapa diperlukan untuk membangkitkan banyak elemen secara efisien. Sumber energi paling praktis untuk spektrometri sinar-x adalah tabung sinar-x (Gbr 3).
Spektrometer WDXRF membutuhkan eksitasi berdaya tinggi yang efisien untuk bekerja dengan baik. Oleh karena itu, stabilitas dan keandalan tabung sinar-x adalah penting. Semua komponen berada dalam vakum tinggi. Sebuah filamen dipanaskan oleh tegangan filamen 6 V sampai 14 V. Filamen yang dipanaskan secara termal memancarkan elektron. Fluks elektron yang mengalir antara filamen dan anoda target harus diatur dan dikendalikan dengan sangat baik. Aliran elektron ini adalah arus listrik dan biasanya diukur dalam mili-ampere. Arus tabung sering disebut sebagai mA.
Potensi beberapa kilovolt diterapkan antara filamen (katoda) dan anoda target, yang berfungsi sebagai potensi percepatan elektron. Tegangan ini biasanya diukur dalam kilovolt. Anoda biasanya tembaga, dan permukaan target dilapisi dengan deposit kemurnian tinggi dari unsur-unsur seperti rhodium, perak, kromium, molibdenum, atau tungsten. Tabung sinar-X yang digunakan untuk spektrometri WDXRF beroperasi pada 2 kW hingga 3 kW. Sebagian besar daya ini hilang sebagai panas, dan diperlukan adanya pendingin air pada tabung sinar-x. Catu daya dan elektronik terkait untuk tabung sinar-x ini berukuran besar. Elektron menyerang target dengan energi kinetik maksimum yang setara dengan potensial tabung yang diterapkan. Jika energi kinetik elektron melebihi energi tepi serapan yang sesuai dengan pengeluaran elektron orbital dalam dari atom bahan target, tabung memancarkan karakteristik garis sinar-x dari elemen target. Interaksi elektron dalam berkas dengan elektron dari elemen target juga menyebabkan emisi kontinum. Area kontinum dan panjang gelombang dengan intensitas maksimum bergantung pada potensi, arus, dan komposisi anoda.
Menganalisis kristal – Sinar-X yang dipancarkan oleh tabung sinar-x diarahkan ke sampel. Dalam kebanyakan spektrometer sinar-x, sampel ditempatkan di atas tabung sinar-x dalam apa yang dikenal sebagai optik terbalik. Ini memfasilitasi pemosisian permukaan cairan menggunakan permukaan bawah daripada atas. Radiasi x yang dipancarkan dari sampel terkolimasi dan mengenai permukaan kristal penganalisis, yang menyebarkan radiasi. Berkas paralel radiasi-x polikromatik dari sampel didifraksikan dari bidang kisi yang berbeda dalam kristal. Penguatan terjadi jika jarak tambahan yang ditempuh radiasi melalui difraksi dari bidang kisi yang berbeda sama dengan kelipatan bilangan bulat dari panjang gelombang. Jika ini tidak terjadi, interferensi destruktif terjadi. Hukum Bragg memungkinkan perhitungan sudut di mana panjang gelombang akan dipilih untuk menganalisis kristal.
Detektor – Detektor dan elektronik terkait dalam spektrometer WDXRF mendeteksi sinar-x yang terdifraksi dari kristal penganalisis dan menolak sinyal yang tidak diinginkan seperti difraksi orde tinggi atau rendah oleh kristal penganalisis atau noise detektor. Dua detektor biasanya diposisikan bersama-sama. Yang pertama adalah detektor proporsional berisi gas atau gas mengalir. Detektor ini terdiri dari kawat yang diisolasi dari rumah. Jendela polimer tipis di bagian depan dan belakang rumah memungkinkan masuknya dan kemungkinan keluarnya radiasi-x. Potensi bias beberapa ratus volt diterapkan antara kabel dan rumahan.
Meskipun banyak gas dapat digunakan, gas tipikal adalah P-10, campuran 90% argon (Ar) dan 10% metana. Ketika sinar-x memasuki detektor, argon terionisasi untuk menghasilkan banyak pasangan Ar+-e-. Kawat anodik mengumpulkan elektron, dan elektron pada dinding katodik wadah menetralkan ion Ar+. Hasilnya adalah pulsa arus untuk setiap foton sinar-x yang masuk ke detektor. Detektor proporsional terisi P-10 paling efisien untuk mendeteksi foton sinar-x dengan energi kurang dari sekitar 8 keV (panjang gelombang lebih tinggi dari sekitar 0,15 nm). Radiasi x yang lebih energik cenderung melewati detektor proporsional.
Detektor kedua yang sering terletak di belakang pencacah proporsional biasanya merupakan detektor kilau. Detektor ini terdiri dari kristal natrium iodida yang didoping talium [NaI(Tl)], yang memancarkan semburan cahaya biru (410 nm) ketika terkena foton sinar-x. Kristal dipasang pada tabung photomultiplier yang mendeteksi pulsa cahaya. Jumlah foton cahaya yang dihasilkan sebanding dengan energi foton sinar-x yang datang. Setelah pemrosesan elektronik, semburan kilau diubah menjadi pulsa tegangan yang proporsional dalam amplitudo dengan energi foton sinar-x. Kedua detektor ini dapat dioperasikan secara independen atau bersamaan. Dalam operasi simultan, potensi operasi detektor dan penguatan keluaran harus disesuaikan sehingga foton sinar-x dari energi tertentu menghasilkan tegangan tinggi-pulsa yang sama dari kedua detektor. Kedua jenis detektor membutuhkan sekitar 1 mikro-detik untuk pulih di antara pulsa. Beberapa hitungan dapat hilang pada laju foton insiden yang lebih besar dari sekitar 30.000/dtk. Diskriminasi tinggi-pulsa dari pulsa sinar-x dari detektor menolak sinar-x orde lebih tinggi atau lebih rendah difraksi dari kristal penganalisis.
Dasar-dasar operasi – Ketika sampel dipertimbangkan dan elemen analit dipilih, keputusan pertama adalah memilih garis emisi. Dengan tidak adanya interferensi spesifik, biasanya digunakan jalur paling energik yang masuk akal. Untuk unsur-unsur dengan nomor atom kurang dari sekitar 75, ini biasanya adalah garis K, karena banyak spektrometer WDXRF dapat beroperasi hingga potensial 100-kV untuk tabung sinar-x. Jika memungkinkan, tabung sinar-x dipilih yang memancarkan garis karakteristik pada energi tepat di atas tepi absorpsi untuk garis yang akan digunakan untuk elemen analit. Ketika tabung seperti itu tidak tersedia, eksitasi harus dilakukan dengan menggunakan kontinum untuk tabung sinar-x yang tersedia.
Potensi tabung sinar-x diatur sekitar 1,5 kali energi tepi serapan atau lebih tinggi. Detektor harus dipilih berdasarkan daerah panjang gelombang yang akan digunakan. Pencacah proporsional akan digunakan untuk sinar-x yang lebih panjang dari sekitar 0,6 nm, detektor kilau untuk panjang gelombang yang lebih pendek dari sekitar 0,2 nm, dan keduanya untuk daerah tumpang tindih 0,2 nm hingga 0,6 nm. Kristal analisis harus dipilih yang memungkinkan panjang gelombang yang diinginkan dapat dideteksi. Mayoritas pemilihan parameter dilakukan melalui kontrol komputer.
Spektrometer sinar-x dispersi energi
Penggunaan goniometer dalam spektrometer sinar-x WDXRF didasarkan pada persyaratan untuk menguraikan ke dalam komponen-komponen sinar-x yang dipancarkan oleh berbagai elemen dalam sampel. Penggunaan perangkat dispersi adalah umum di banyak jenis spektroskopi untuk menyelesaikan tugas ini. Instrumen tanpa komponen mekanis diinginkan jika resolusi yang memadai dapat dicapai. Pengembangan detektor silikon lithium-drift dan aplikasinya pada deteksi sinar-x pada pertengahan 1960-an mengarah ke bidang analisis spektroskopi yang kemudian dikenal sebagai spektrometri EDXRF.
Tabung sinar-X yang digunakan dalam spektrometer WDXRF memiliki nilai 2 kW hingga 3 kW dan harus didinginkan dengan air. Yang digunakan dalam spektrometer EDXRF beroperasi pada daya yang jauh lebih rendah dan biasanya berpendingin udara. Tabung tipikal berkisar dari 9 W hingga 100 W. Tersedia bahan anoda yang berbeda, dan setiap produsen spektrometer sinar-x menawarkan fitur tabung sinar-x khusus. Namun, setelah banyak uji coba desain tabung, sebagian besar tetap menggunakan desain 'jendela samping' tradisional, meskipun jauh lebih kecil daripada yang digunakan dalam spektrometer WDXRF. Faktor utama dalam desain tabung dan catu daya terkait adalah stabilitas tabung dan tegangan.
Sebuah alternatif untuk eksitasi tabung sinar-x langsung adalah penggunaan eksitasi target sekunder. Dalam mode ini, tabung sinar-x digunakan untuk menyinari target sekunder, yang karakteristik fluoresensi sinar-x-nya digunakan untuk merangsang emisi sinar-x sampel. Karena hilangnya efisiensi yang substansial saat menggunakan target sekunder, tabung sinar-x dengan watt lebih tinggi diperlukan daripada yang dibutuhkan untuk eksitasi langsung.
Eksitasi target sekunder terkadang memberikan keuntungan yang signifikan. Misalnya, untuk menentukan tingkat konsentrasi rendah vanadium dan kromium dalam sampel besi, elemen-elemen ini dapat dieksitasi dengan target sekunder besi tanpa eksitasi besi dalam sampel. Dengan eksitasi tabung langsung ini sulit. Beberapa target sekunder diperlukan untuk mencakup berbagai elemen. Penggunaan eksitasi target sekunder telah didukung sebagai sumber radiasi monokromatik untuk eksitasi. Pentingnya keuntungan ini adalah bahwa banyak program komputer dengan parameter dasar, yang digunakan untuk menghitung intensitas langsung dari persamaan sinar-x dasar, memerlukan radiasi eksitasi monokromatik.
Dalam praktiknya, eksitasi target sekunder hanya mendekati radiasi monokromatik yang ideal. Eksitasi tabung langsung dengan filter primer yang sesuai berkinerja baik jika dibandingkan dengan teknik target sekunder. Oleh karena itu, eksitasi tabung sinar-x langsung tetap menjadi yang paling praktis untuk sejumlah besar aplikasi spektrometri dispersi energi (EDS). Kekuatan utama teknik EDS terletak pada kemampuan analisis multi-elemennya yang simultan. Although special cases occur in which selective excitation is desirable, this frequently can be accomplished with intelligent use of an appropriate x-ray tube and filter. Any fundamental design features which limit the simultaneous multi-element capability diminish the advantage of the EDXRF spectrometer.
Since direct x-ray tube excitation is the most common method used in EDS, there are factors which govern the selection of an x-ray tube. In wavelength-dispersive techniques, several x-ray tubes are normally available for the spectrometer. These can be changed for different applications. This is not normally the case with EDS-systems, since many WDXRF spectrometer has few if any choices of primary filters. In wavelength-dispersive techniques, it is customary to attempt to excite the desired element by the characteristic emission lines of the tube anode material, but the continuum is used more efficiently in EDXRF spectrometers. The use of EDXRF spectrometers has been enhanced by computer control of tube current and voltage and selection of the primary filter. Selection and efficient use of a single x-ray tube is important in the configuration of an EDXRF system.
Characteristic lines emitted by an x-ray tube have much larger intensity at their maxima than the continuous radiation emitted. These lines are to be used for excitation whenever possible. In addition, use of a primary filter between the x-ray tube and the sample can effectively approximate monochromatic radiation impinging on the sample from these characteristic lines. EDXRF spectrometers normally offer various x-ray tube anode materials. For selecting the x-ray tube anode material, the applications most likely to be encountered are to be considered.
The principal concern is to select an anode which has characteristic lines close to, but always higher, in energy than the absorption-edge energies to be encountered. None of the characteristic lines are to create spectral interference with elements to be determined. This includes consideration of such details as the Compton scatter peak for the characteristic lines. In addition, it is difficult to perform determinations of the element of the anode material. This is especially true with samples having low concentrations of that element.
Rhodium is a favourable tube anode material for general-purpose use. The characteristic lines of this element are efficient for the excitation of elements with absorption edges to around 15 keV. The excitation efficiency for the K lines of the transition elements is low. However, the continuum can be used efficiently in this region. Rhodium also has characteristic L lines at around 2.7 keV to 3.0 keV. These are efficient for the excitation of the K lines of low atomic number elements, such as aluminum, silicon, phosphorus, and sulphur. However, in these cases, a silver anode is preferable because of the Compton scatter radiation from the rhodium lines. The characteristic lines and the continuum from the x-ray tube can be used for excitation.
Although the elements of many samples can be excited effectively using a combination of the characteristic x-ray lines from the tube anode element and the continuum, more monochromatic radiation is sometimes desired. One such situation involves enhancing the use of fundamental-parameter computations which permit quantitative determination of elements without the need for several concentration standards. A more frequent situation is the need to reduce the background in the spectrum energy range to be used in the analysis. Use of primary filters placed between the x-ray tube and the sample can be effective in these cases and are normally incorporated under computer control in commercial spectrometers.
The object is to filter the primary radiation from the x-ray tube and selectively pass the characteristic lines of the anode element. This is accomplished using a filter made of the same element as the tube anode. Since x-rays of a given line (K, L, and so on) of an element are lower in energy than the absorption edge for that element, the photoelectric component of the mass absorption coefficient is small. Such a filter does not efficiently absorb the characteristic line emitted by the x-ray tube. The higher energy x-rays from the continuum are efficient for the photoelectric process in the filter and are highly attenuated by absorption. X-rays of lower energy than the filter material absorption edge are absorbed more efficiently as the energy decreases.
The result is x-radiation striking the sample with an intensity which is largely determined by the characteristic lines of the tube anode and that approximates monochromatic radiation. Increasing the thickness of the filter decreases the total intensity, with further gain in the monochromatic approximation.
Detectors – The selective determination of elements in a mixture using x-ray spectrometry depends upon resolving into separate components the spectral lines emitted by the different elements. This process needs an energy-sorting or wavelength-dispersing device. For the WDXRF spectrometer, this is accomplished by the analyzing crystal, which needs mechanical movement to select each desired wavelength according to Bragg’s law. Optionally, several fixed-crystal channels can be used for simultaneous measurement. In contrast, EDS is based on the ability of the detector to create signals proportional to the x-ray photon energy. Hence, mechanical devices, such as analyzing crystals, are not needed.
Several types of detectors have been used, including silicon, germanium, and mercuric iodide. The solid-state, lithium-drifted silicon detector [Si(Li)] was developed and applied to x-ray detection in the 1960s. By the early 1970s, this detector was firmly established in the field of x-ray spectrometry and was applied as an x-ray detection system for SEM and x-ray spectrometry. The Si(Li) detector provides excellent resolution. It can be considered as a layered structure. Under reversed bias of around 600 V, the active region acts as an insulator with an electric-field gradient throughout its volume.
When an x-ray photon enters the active region of the detector, photo ionization occurs with an electron-hole pair created for each 3.8 eV of photon energy. Ideally, the detector is to completely collect the charge created by each photon entry and result in a response for only that energy. Some background counts appear because of energy loss in the detector. Although these are kept to a minimum by engineering, incomplete charge collection in the detector contributes to background counts. From 1 keV to 20 keV, an important region in x-ray spectrometry, silicon detectors are efficient for conversion of x-ray photon energy into charge.
Analyzer systems – The x-ray spectrum of the sample is obtained by processing the energy distribution of x-ray photons which enter the detector. One x-ray photon entering the detector causes photo-ionization and produces a charge proportional to the photon energy. Several electrical sequences are to take place before this charge can be converted to a data point in the spectrum. A detailed knowledge of the electronics is not necessary, although an understanding of their functions is important. Upon entering the Si(Li) detector, an x-ray photon is converted into an electrical charge which is coupled to a field effect transistor (FET). The FET and the electronics comprising the preamplifier produce an output proportional to the energy of the x-ray photon. Using a pulsed optical preamplifier, this output is in the form of a step signal. Since photons vary in energy and number per unit time, the output signal, due to successive photons being emitted by a multi-element sample, resembles a staircase with various step heights and time spacing. When the output reaches a determined level, the detector and the FET circuitry reset to their starting level, and the process is repeated.
The preamplifier output is coupled to a pulse processor which amplifies and shapes the signal into a form acceptable for conversion to a digital form by an analog-to-digital converter (ADC). Amplification is necessary to match the analog signal to the full-scale range of the ADC. This process involves the energy calibration of the spectrometer. Drift in the gain and/or offset (zero) of the amplification results in errors in the energy assigned to the x-ray photons producing the signal. Hence, these calibrations are to be as stable as possible, and calibration is to be routinely checked.
The energy calibration is important for qualitative identification of the elements and for precise quantitative results when using spectrum-fitting programs. The amplifier provides gain and zero controls for calibrations. Normal operation in x-ray spectrometry is to set the time on the system clock to be used to acquire the spectrum. The processing of the pulses is not instantaneous. At high count rates, the time needed can become significant. When a pulse is detected and processing initiated, the clock is ‘stopped’ until the system is ready to process a new photon. The length of time the clock is off is called dead time; the time the clock is on is called live time. Their total is real time. The system monitors live time. If the spectrometer is operated with a 50 % dead time, the real time is twice the live time.
Processing of the pulse created by a photon is to be complete before another pulse occurs. A pulse pile-up rejector circuit blocks a pulse if it is received too soon. Once activated, the pulse pile-up rejector prevents the new signal from being processed if a second x-ray enters the detector before a prior pulse is fully processed. If analysis of the prior pulse had not yet been complete, it is also to be blocked from further processing. If this blockage is not performed, pulse pile-up occurs, resulting in an artifact which appears at energies equal to the sum of the photon energy of the first and second photons to enter the detector. These are frequently called sum peaks.
Despite pulse pile-up rejection circuitry, sum peaks are observed for intense peaks in the spectrum. This is the result of two photons entering the detector simultaneously or within a time difference faster than the fast discriminator can act. Sum peaks can be observed at twice the energy of an intense peak and / or at the sum of the energies of two intense peaks in the spectrum. Sum peaks decrease rapidly in intensity with count rate. The importance of electronic pulse-processing components to system performance is easily overlooked in EDS. However, stability, linearity, and proper calibration of these components are important for the use of the spectrometer.
EDXRF spectrometers require a dedicated computer system for data acquisition. Early spectrometers were heavy, unwieldy units which used hard-wired multichannel analyzers which could acquire data, but could do little to process it. Current spectrometer and data systems based on microprocessor technology are available as table-top units.
Fundamentals of operation – The simultaneous multi-element capability of EDS complicates the selection of optimum conditions because of the factors to be considered for each element. The compromises in spectroscopy are to be made, but the initial selection of instrument operating conditions can follow a logical sequence of decisions.
Qualitative analysis needs similar procedures, normally with less stringent requirements. Once a sample is received for analysis and the elements to be determined by x-ray spectrometry are identified, the next decision is to ascertain which x-ray lines are to be used for the determinations. As a general rule, K lines are used upto a K absorption-edge energy a few keV below the characteristic line of the x-ray tube anode element. The continuum can be used for excitation if the voltage to the x-ray tube is set sufficiently high to place the continuum maximum at energy higher than the absorption edge and if a back-ground filter is used. In these cases, K absorption-edge energies can be used upto around 66 % of the maximum operating kV of the x-ray tube. However, the observed peaks lie on a continuum background and reduce the signal-to-noise ratio.
For a 50-kV x-ray tube, absorption edges as high as 30 keV can be used if the element is present in sufficient concentration. For a 30-kV rhodium or silver tube, one is restricted essentially to excitation by the characteristic tube lines. This is of no great concern unless there is a special interest in the elements between atomic numbers 41 and 50 (niobium to tin). Elements above atomic number 50 (40 for a 30-kV system) are normally to be determined using the L lines of their x-ray spectra.
To excite all L lines, the incident x-ray photon energy is to exceed the LI absorption edge. For practical use, the energy of the L lines is to be higher than around l keV. For the L line spectra, this needs atomic numbers higher than 30. At such low x-ray energies, absorption of the x-rays and low fluorescent yield in the L emission in this region needs high concentration of the element to be determined and excellent sample preparation. Overlap of the K lines of the low atomic number elements in this region also causes difficulty. For example, the K lines of phosphorus overlap with the L lines of zirconium and the M lines of iridium at around 2 keV. These problems are to be considered, but are to a large degree solved by careful use of processing software.
Once the x-ray spectral lines are selected for determination of the elements, the next step is to decide whether all analyte elements in the sample can be determined with one instrumental setting. Although the multi-element capability of EDS is useful, all elements in every sample cannot be determined with a single set of instrument parameters. Some applications need more than one condition, such as a mixture of low atomic number elements and transition elements. The transition elements are best determined by excitation using the K lines of rhodium or silver and the low atomic number elements with the L lines or a properly adjusted continuum using a background filter. Computer control of instrument parameters facilitates changing the conditions. Whether automatic or manual control is used, all samples are to be analyzed under one set of conditions, then analyzed again using the alternate set. This is preferred over changing conditions between samples.
X-ray tube operating voltage affects the efficiency of excitation of each element in the spectrum and the integrated x-ray photon flux from the tube. The tube current affects the flux only. Hence, once the operating kV has been set, the tube current typically is adjusted until the system is processing counts efficiently. System dead time is to be maintained below, but near, 50 %. The voltage and current settings for the x-ray tube have a sensitive effect on the rate of information acquisition and count distribution among the respective spectral peaks for a given type of sample.
Selection of primary tube filter thickness is important. If the filter is changed, the tube current, and sometimes the voltage, frequently needs resetting since the filter alters the intensity distribution of the x-rays striking the sample. When characteristic tube lines are used for excitation, the filter is normally made from the tube anode element. The intensity of the transmitted x-rays decrease exponentially with increasing filter thickness. It is common to have two or three primary filters made from the tube anode element in the filter holder. The selection is to reflect optimum count rate corresponding with reasonable current and voltage settings. Thicker filters attenuate lower energy radiation more effectively and reduce the excitation efficiency for the element with low absorption coefficients.
The remaining decision is the choice of atmosphere in the sample chamber. If x-rays below around 5 keV are to be implemented, use of a vacuum can be advantageous. Intensity can increase sufficiently to reduce significantly the counting time needed to achieve an adequate number of counts. If the concentration of elements yielding these x-rays is sufficiently high, the vacuum may not be needed. Because of the extra precautions needed in sample criteria and handling, a vacuum path is not to be used unless significant benefit is realized. Similar reasoning applies to the helium atmosphere.
These guidelines are useful for initial selection of operating conditions. The instrumental parameters are interactive, and a change in one parameter needs adjustment of another. For example, selection of a thicker primary filter or a decrease in the tube voltage needs an increase in the tube current.
Sample preparation
The care taken to determine the best method of sample preparation for a given material and careful adherence to that method frequently determine the quality of results obtained. Sample preparation is the single most important step in an analysis, yet it is frequently given the least attention. In most cases, the stability and overall reproducibility of x-ray instrumentation are the least significant factor affecting the precision of analytical measurements. Frequently, the precision of analytical results expected from x-ray spectrometric determinations is expressed in terms of the theoretical statistics of measurement of x-ray intensities.
When replicate samples are prepared and actual standard deviations measured, deviations are found to be larger than those predicted by counting statistics. If precision is poor, any one analytical result can also be poor, since it can differ substantially from the ‘true’ value. The variety of sample types which can be analyzed using x-ray spectrometry necessitates different sample preparation techniques.
Samples are frequently classified as infinitely thick or infinitely thin based on measurement of the attenuation of x-rays. Samples are considered to be infinitely thick if further increase in the thickness yields no increase in observed x-ray intensity. The critical value for infinite thickness depends on the energy of the emitted x-radiation and the mass absorption coefficient of the sample matrix for those x-rays. For pure iron, the critical thickness is around 40 m for iron x-rays.
Although infinitely thin samples afford several advantages, it is rarely feasible to prepare them from routine samples. Many samples fall between these two cases and need extreme care in preparation. In addition to preparation of the sample, precise positioning of the sample in the spectrometer is critical for quantitative determinations.
Solid samples – These are defined as single bulk materials, as opposed to powders, filings, or turnings. Solid samples can frequently be machined to the shape and dimensions of the sample holder. The processing is not to contaminate the sample surface to be used for analysis. In other cases, small parts and pieces are to be analyzed as received. The reproducible positioning of these samples in the spectrometer is critical. It is frequently useful to fashion a wax mould of the part which fits into the sample holder. Using the mould as a positioning aid, other identical samples can be reproducibly placed in the spectrometer.
Samples taken from unfinished bulk material frequently needs surface preparation prior to quantitative analysis. Surface finishing can be done using a polishing wheel, steel wool, or belt grinder, with subsequent polishing using increasingly fine abrasives. Surface roughness less than 100 micrometers is normally sufficient for x-ray energies above around 5 keV, but surface roughness of less than 20 micrometers to 40 micrometers is needed for energies down to around 2 keV. Several precautions are necessary. Alloys of soft metals can smear on the surface as the sample is polished, resulting in a surface coating of the soft metal which yields high x-ray intensities for that element and subsequently high analytical results.
Polishing grooves on the surface of the sample can seriously affect the measured intensity of low-energy x-rays. This can be examined by repetitive measurement of the intensity of a sample after 45 degrees or 90 degrees rotation. Use of a sample spinner reduces this effect. If a sample spinner is not available, the sample is to be placed in the spectrometer such that the incident x-radiation is parallel to the polishing direction.
Powders and briquettes – Powder samples can be received as powders or prepared from pulverized bulk material too inhomogeneous for direct analysis. Typical bulk samples pulverized before analysis are ores, and refractory materials. Powders can be analyzed using the spectrometer, pressed into pellets or briquettes, or fused with a flux, such as lithium tetra borate. The fused product can be reground and pressed or cast as a disk. For precise quantitative determinations, loose powders are rarely acceptable, especially when low-energy x-rays are used. Pressed briquettes are more reliable. However, experience indicates that the best compromise is reground and pressed fusion products. This technique eliminates several problems associated with particle-size effects.
Particle-size effects result from the absorption of the incident and emitted x-rays within an individual particle. If the mass absorption coefficient of the sample matrix is high for the x-radiation used, particles even a few microns in diameter can considerably affect attenuation of the radiation within each particle. If the sample consists of particles of various sizes, or the particle size varies between samples, the resulting x-ray intensities can be difficult to interpret. This problem is compounded by the tendency of a material composed of a mixture of particle sizes to segregate when packed.
Determination of elements using low-energy x-radiation can lead to errors from particle-size effects of as much as 50 %. If the needed speed of analysis prohibits use of fusion techniques, direct determination from packed powders can be considered. The sample is to be ground, if possible, to a particle size below the critical value. The grinding time needed frequently can be ascertained by measuring the intensity from a reference sample at increasing grinding times until no further increase is observed. The lowest energy x-ray to be used in analysis is to be selected for this test.
Briquettes or pressed powders yield better precision than packed powder samples and are relatively simple and economical to prepare. In several cases, only a hydraulic press and a suitable die are needed. In the simplest case, the die diameter is to be the same as the sample holder so that the pressed briquettes fit directly into the holder. The amount of pressure needed to press a briquette which yields maximum intensity depends on the sample matrix, the energy of the x-ray to be used, and the initial particle size of the sample. Hence, prior grinding of the sample to a particle size which is less than 100 micrometers is advisable.
A series of briquettes are to be prepared from a homogeneous powder using increasing pressure. The measured intensity of the x-ray lines to be used in the analysis is plotted versus the briquetting pressure. The measured intensity is to approach a fixed value, perhaps asymptotically. Pressures of 138 MPa to 276 MPa may be needed. For materials which do not cohere to form stable briquettes, a binding agent is needed. Acceptable binding agents include powdered cellulose, detergent powders, starch, stearic acid, boric acid, lithium carbonate, polyvinyl alcohol, and commercial binders.
Briquettes which are not mechanically stable can be improved by pressing them into backing of pre-pressed binder, such as boric acid, or by the use of a die which presses a cup from a binding agent. The sample powder can then be pressed into a briquette supported by the cup. Improved results are frequently achieved if around 0.1 mm to 0.5 mm is removed from the surface of the briquette prior to the measurement.
Fusion of materials – Fusion of materials with a flux can be performed for several reasons. Some refractory materials cannot be dissolved, ground into fine powders, or converted into a suitable homogeneous form for x-ray spectrometric analysis. Other samples can have compositions which lead to severe inter-element effects, and dilution in the flux reduces these. The fused product, cast into a glass button, provides a stable, homogeneous sample well suited for x-ray measurements. The disadvantages of fusion techniques are the time and material costs involved as well as the dilution of the elements which can result in a reduction in x-ray intensity. However, when other methods of sample preparation fail, fusion frequently provides the needed results.
Low-temperature fusions can be carried out using potassium pyro-sulphate. More common are the glass-forming fusions with lithium borate, lithium tetra-borate, or sodium tetra-borate. Flux-to-sample ratios range from 1:1 to 10:1. The lithium fluxes have lower mass absorption coefficients and hence less effect on the intensity of the low-energy x-rays. An immense variety of flux-additive recipes are reported for various sample types. Lithium carbonate can be added to render acidic samples more soluble in the flux. Lithium fluoride has the same effect on basic samples. Lithium carbonate also reduces the fusion temperature. Oxidants, such as sodium nitrate and potassium chlorate, can be added to sulphides and other mixtures to prevent loss of these elements.
Filters and ion-exchange resins – Various filters, ion-exchange resin beads, and ion-exchange resin-impregnated filter papers have become important sampling substrates for samples for x-ray spectrometric analysis. Filter materials can be composed of filter paper, membrane filters, glass fiber filters, and so on. Filters are used in a variety of applications. One widely used application is in the collection of aerosol samples from the atmosphere. Loadings of several milligrams of sample on the filter can correspond to sampling several hundred cubic meters of atmosphere. Such sampling can be performed in any environment. Many elements can be determined directly on these filters by x-ray spectrometric analysis. Particulate samples collected in this way present problems, stemming primarily from particle-size effects, which are reduced in part by the need to collect two particle-size regions using dichotomous samplers. With these units, particles are separated into those smaller and those larger than around 2 micrometers in diameter.
The smaller particles tend to represent man-made materials; the larger ones are of natural origin. The smaller particles show fewer particle-size effects, and an x-ray spectrometric determination of even low atomic number elements, such as sulphur, is possible. Glass fiber filters are frequently used for this purpose. Filters can also be used for non-aerosol atmospheric components, such as reactive gases. Filter materials can be impregnated with a reagent reactive to the gas which traps it chemically. Sampling is accomplished by conveying atmospheric gases through a treated filter under carefully controlled conditions. An example is a damp filter treated with ferric ion solution used to trap hydrogen sulphide. The excess iron can be rinsed from the filter, but the precipitated ferrous sulphide remains. The sulphur can be determined directly or indirectly by measuring the iron x-radiation. The key to determining atmospheric components is the development of suitable standards.
Filters can be used to determine solution components in ways parallel to those described for atmospheric components. Particulate materials can be filtered directly from solution. For example, particulate materials in environmental water samples are defined as that which is filtered using a 0.45 micrometer pore diameter membrane filter. Hence, filtration of particles from water can be accomplished using such filters, and direct x-ray spectrometric analysis performed. Application of filter sampling to dissolved elements in water is becoming more common. The principle is similar to the reactive reagent-impregnated filter application to atmospheric gases. In some cases, the filter can be impregnated with ion-exchange resins which trap ions as the solution passes through the filter.
Procedures using ion-exchange resin-impregnated filters are to be carefully checked, since several passes of the solution can be needed, and distribution of the ions across the paper thickness is seldom uniform. However, for solutions, a reaction can be performed prior to filtration. For example, many ions can be precipitated quantitatively from aqueous solution, even at parts per billion concentration levels. The precipitates can be collected using 0.45 micrometers pore diameter membrane filters, which are then mounted between two Mylar sheets retained by ring clips on a standard plastic sample cup. Simultaneous multi-element determinations are then performed using XRF spectrometer.
Detection limits on the filters of as low as a few tenths of a microgram are common. If 100 g of sample solution is used, this corresponds to the detection limits of a few parts per billion in the sample. Standards are easily prepared as aqueous solutions. ‘Standard reference materials’ (SRM) for environmental waters and industrial effluent water are available.
Thin-film samples – Thin-film samples are ideal for x-ray spectrometric analysis. The x-ray intensity of an infinitely thin sample is proportional to the mass of the element on the film, and the spectral intensities are free of inter-element and mass absorption coefficient effects. However, in practice, perfect thin-film samples are rarely encountered. Powder samples of sufficiently small and homogeneous particle size can be distributed on an adhesive surface, such as cellophane tape, or placed between two drum-tight layers of Mylar film mounted on a sample cup.
More important thin-film types are platings and coatings on various substrates. Analysis of these sample types is increasingly important for the electronics industry. Of particular concern are measurements of film thickness and composition. Several techniques can be used, including the substrate intensity attenuation method, the coating intensity method, various intensity ratio methods, and the variable takeoff angle method. The last method is not practical in most commercial spectrometers. To be infinitely thin to most x-rays used in x-ray spectrometric analyses, the samples are to be 10 micrometers to 200 micrometers thick.
Liquids – Liquids can also be analyzed using x-ray spectrometry. The design of x-ray spectrometric instrumentation using inverted optics, in which the sample is above the x-ray source and detector, facilitates the use of liquid samples. This convenient geometry demands caution in the preparation of liquid samples to avoid damaging the source or detector by such accidents as spills and leaking sample cups.
Quantitative standards are easily prepared for liquid samples. However, since solvents are normally composed of low atomic number elements, the Rayleigh and Compton scatter intensity is high, which increases background and leads to high limits of detection. These problems can be minimized by use of suitable primary tube filters, which reduce the scattered x-radiation in the analytically useful region.
Care is to be taken with liquids containing suspended solids. If the suspension settles during the measurement time, the x-ray intensity of the contents of the sediment is enhanced. The x-ray intensity from solution components or homogeneous suspension can decrease as a result of sediment absorption, which leads to erroneous results. This possibility is tested by brief, repetitive measurements, beginning immediately after a sample is prepared. Any observed increase or decrease in intensity with time indicates segregation in the sample. In these cases, an additive which stabilizes the suspension can be used, or the suspended content can be collected on a filter for analysis.
Special sample types – Applications of x-ray spectrometric analysis do not always provide convenient samples which can fit one of the above categories. Non-destructive analyses are occasionally needed on production products which are not 32 mm diameter circles of infinite thickness. Examples include computer disks, machined parts, and long, coated strips or wire. In these cases, a sample compartment which accommodates the samples can frequently be designed. With the development of the mercuric iodide detector, which can provide adequate resolution for many analyses without a liquid nitrogen dewar, special analytical systems for on-line and non-destructive analysis of large samples can become increasingly feasible.
Proses manufaktur
1. Pengaruh Jarak Pemesinan (Kelonggaran Samping) Ukuran celah pemesinan dan konsistensinya secara langsung memengaruhi akurasi pemesinan EDM. Hanya dengan menguasai nilai numerik celah pemesinan dan kekasaran permukaan setiap standar, ukuran elektroda dapat dirancang dengan benar, jumlah penyusut
Pada postingan sebelumnya, kita telah membahas tentang proses pembuatan dan cacat dari LCD. Apa lagi yang perlu Anda ketahui? Mari kita beralih ke topik penting lainnya, harga LCD. Terutama ada 4 bagian dalam artikel ini:faktor penentu harga , komposisi harga , fluktuasi harga dan tren masa depan .
Dokumen ini menyediakan prosedur pemecahan masalah untuk mengatasi masalah kualitas speaker. Kami menganalisis gejala umum selama pembuatan speaker, termasuk kebisingan, volume rendah, dan tidak ada suara. Gejala 1:Kebisingan Berikut ini memberikan jenis gangguan dan cara untuk menangkap informasi
Saat ini ada gelombang besar adopsi RFID yang terjadi di ritel fashion dan pakaian. Pertumbuhan ini sebagian besar didasarkan pada kebutuhan akan data stok yang akurat, sementara pada saat yang sama biaya untuk menyebarkan RFID telah menurun secara signifikan. Dalam artikel ini, kami akan memberika